In today’s interconnected world, understanding the landscape of malicious internet cyber activity is crucial for organizations and nation states to protect their digital assets and maintain a strong security posture. To that end, researchers from GreyNoise Labs analysed the volume and type of malicious traffic observed by GreyNoise Intelligence’s planetary scale sensor network — with a hyperfocus on The Netherlands — to help organizations and agencies make more informed decisions about their cybersecurity strategies.
The GreyNoise operated sensor fleet primarily sees opportunistic, mass exploitation. This view provides an up-to-the-minute view of the regular drumbeat of botnet activity, but also sheds light on when new patterns or activity surfaces, especially when there are new, emergent threats.
The term “malicious” is reserved for activity that is associated with an attempt to execute an exploit against a target system.
The data for this report looked at malicious traffic coming from or directed at The Netherlands for a period of 30 days in October 2023.
During that time, GreyNoise observed 125,362 malicious exploitation attempts against The Netherlands’ IP address space and 5,207 attacks from The Netherlands’ being directed at other country-assigned networks.
The sections in this brief will look at the source and destination traffic in more detail and conclude with recommendations for how this information can be used to make organizations, agencies, and citizens safer.
The “Research Notes And References” section provides information on the nuances of source-country attribution.
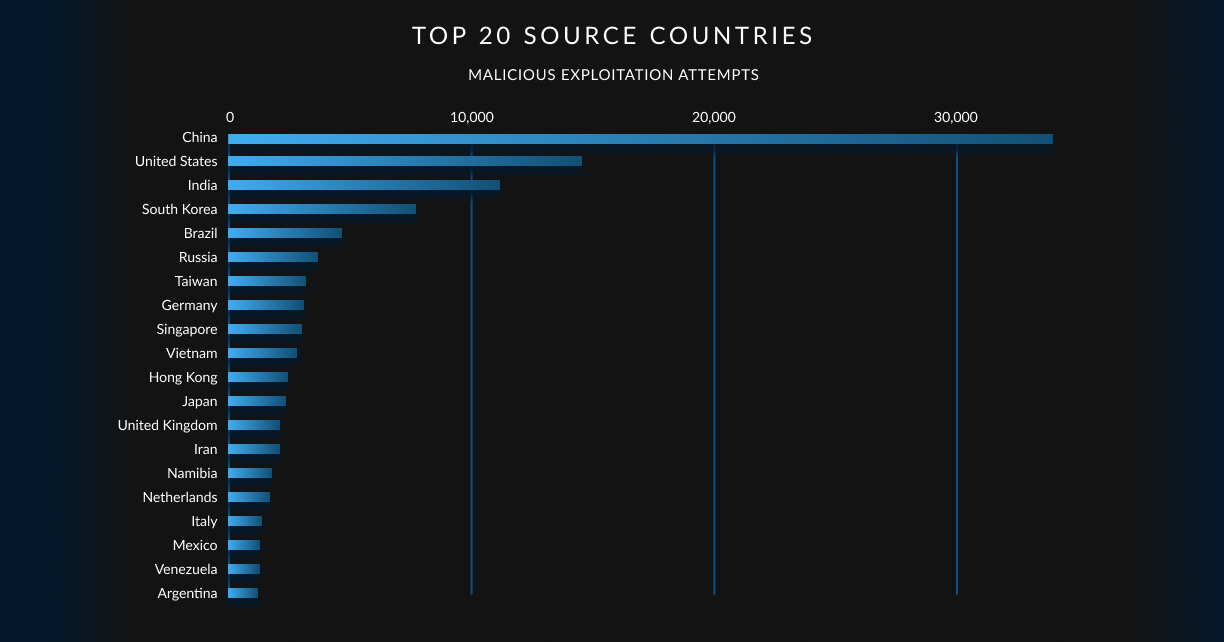
Generally speaking, organizations and agencies can expect to see their malicious source traffic to come from either (a) countries with higher allocated and in-use IP address space, or (b) countries with internet-facing device profiles that lend themselves to be more prone to exploitation.
To see how that mix plays out, Brazil and Vietnam are in fifth and tenth place, below, during the sample period but tenth and twenty-third when it comes to available IP address space. This is due to an inordinately high number of compromised internet of things (IoT) devices, such as IP-accessible cameras, and both white-box and popular-but-regularly-vulnerable networking equipment, such as MicroTik.
This inbound country view will be dynamic if you use the GreyNoise Visualizer or API to perform future assessments. Meaning, members of the list will trade places depending on what adversary controlled infrastructure is in use within any given time period.
You can use geographic source information as one means of risk-assessing connections you see in logs or network flows to help inform blocking or incident response decisions.
The source networks these IP addresses are hosted in can be classified in many ways. For this report, we will focus our attention on the assigned category — ISP, Hosting, Mobile, Business, or Education — for these malicious connection attempts:
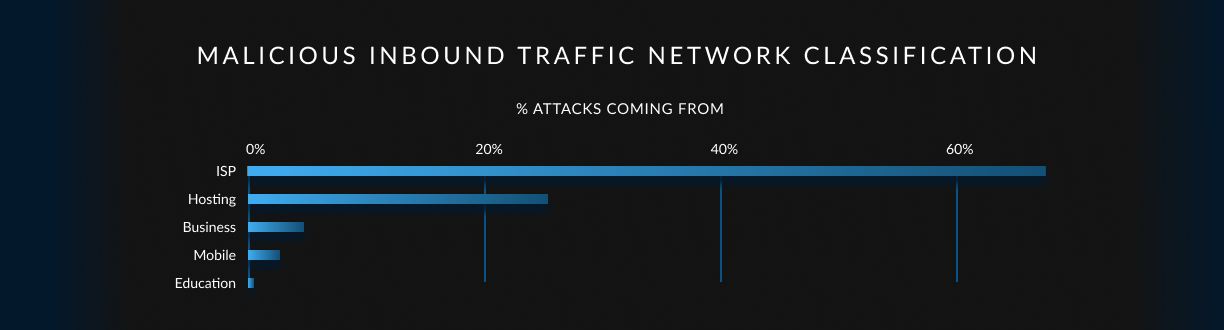
Of initial note is that “Mobile” is fourth on the list. Researchers in GreyNoise Labs have observed a steady up tick in mobile networks — whether it be from tethered systems or compromised Android devices — becoming the source of attack traffic. This increases the burden on defenders, since it is difficult to convince application owners to block any connections from what is around 40-50% of all incoming benign traffic to most websites and web applications. The timely nature of GreyNoise block lists may make such conversations less problematic.
Routers, exposed storage and IoT devices, and compromised laptops/desktops are a large part of why residential and small business ISPs regularly top the list. To understand why, all we need to do is look at the top “tags” (“detections” in intrusion detection and prevention nomenclature) GreyNoise sees in this The Netherlands’ inbound traffic:
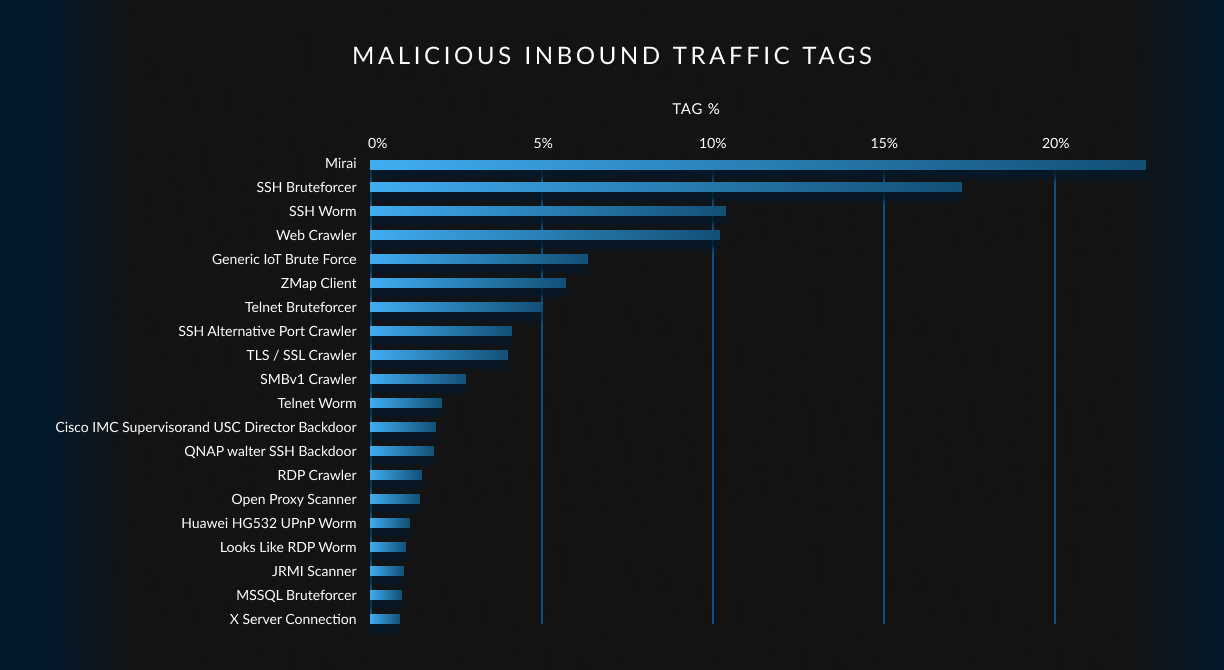
The Mirai botnet is almost always in the number one spot when it comes to malicious, opportunistic activity engaged by our adversaries, but it often trades places with “SSH Bruteforcer”, which is in the number two spot for this date range in Netherlands’ IP space. Both of these traffic sources are the “heartbeat” of the internet. Not a single minute passes without members of the Mirai botnet searching for new and existing hosts to assimilate into its collective. Similarly, attackers regularly hurl thousands of credentials at every remote login point they can reach. This activity, combined with other “Worm”s, help ensure a healthy inventory that can be used in targeted attacks against your agency or organization.
The “Bruteforcer”s can also be used to build up botnet inventories, but they have a secondary nefarious purpose of working to gain Initial Access, which can be sold to bidders on attacker forums. All it takes is for an organization or individual to leave a default or misconfigured system on the internet for less than an hour to have it become part of this adversarial inventory. It is rare for targeted attack infrastructure to be used for this, quite noisy, activity. Therefore, it is strongly advised to consider blocking these attempts at the network level and checking for outbound requests to IP addresses exhibiting this behaviour.
Before we look at what systems and devices in The Netherlands are targeting, we should note that of the 125,362 inbound malicious exploitation attempts, 800 (0.64%) were directed only at The Netherlands’ during the observation period. This may indicate that organizations, such as the Netherlands National Cyber Security Centre (NCSC), Digital Trust Centre (DTC), Cyber Security Incident Response Team for Digital Service Providers (CSIRT-DSP), and the Dutch Police High Crimes Unit are helping to make country networks sufficiently resilient against attacks to force attackers to direct country-centric efforts elsewhere.
During the study period, GreyNoise researchers observed a mere 5,207 malicious exploitation attempts coming from The Netherlands’-attributed network sources.
The outbound tag distribution is nearly identical to the inbound, so we’ll avoid repetition and focus on two points of interest.
First, “Mobile” networks are fourth on the list:
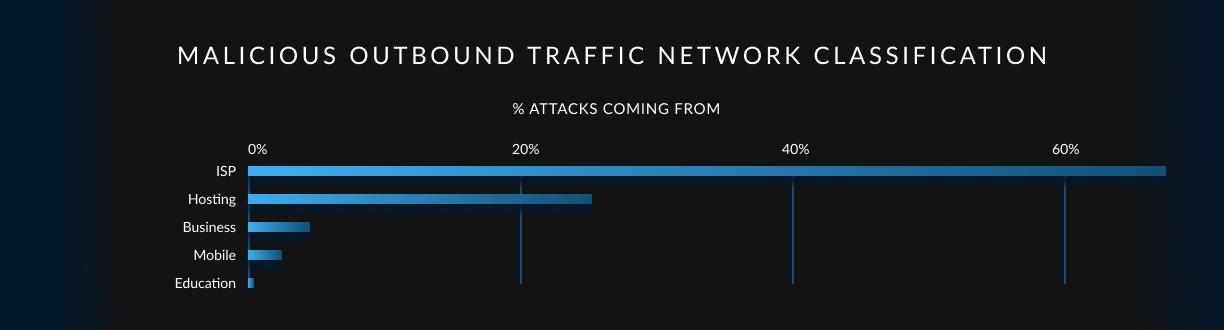
This is somewhat disconcerting given the discussion in the “Inbound” section. Both the NCSC and other organizations that help provide cybersecurity services to mobile providers and small-to-medium-sized Business (they were ahead of “Mobile” on the list) in The Netherlands may want to consider implementing more rigorous malicious activity checks to reduce the likelihood of these networks being increasingly used in adversarial campaigns.
The next, and final, point is that nodes under adversarial control in the Netherlands seem to be aiming at ally networks, though the malicious traffic is also spread around:
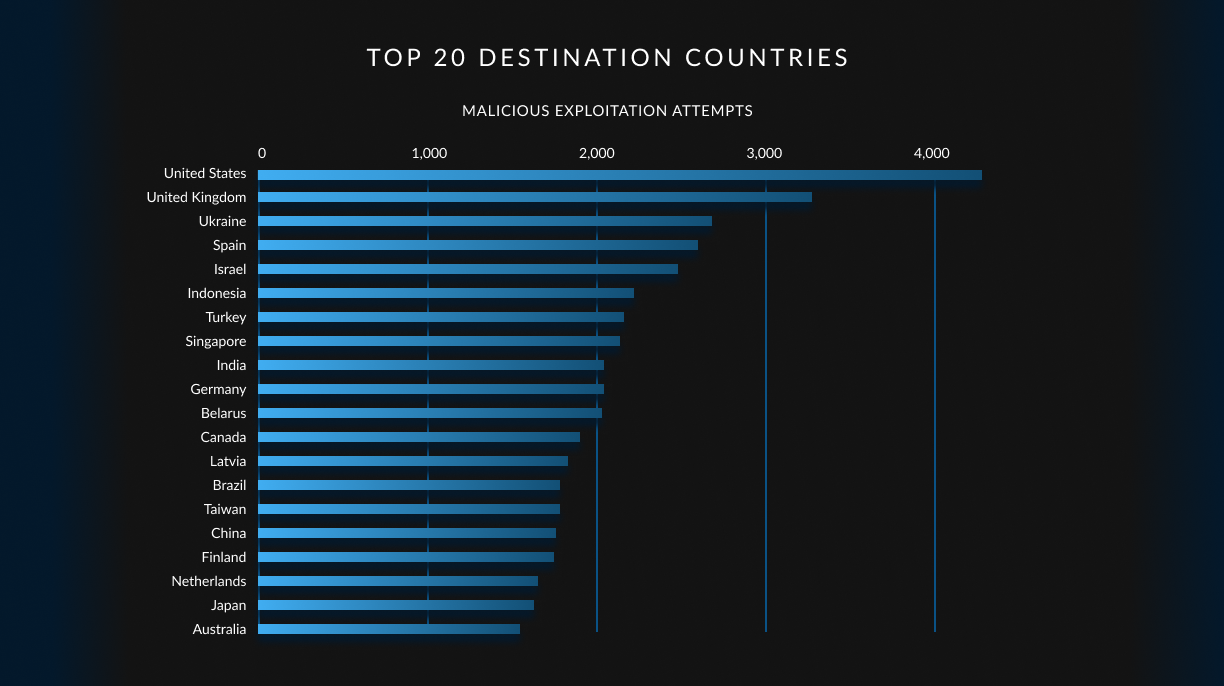
This is unsurprising, as the Netherlands IP address space tends to have a higher positive reputation than many other countries, so initial risk-based “trust” decisions that are part of many perimeter defence systems are more likely to let connections from the Netherlands IP sources through.
Organizations can use GreyNoise to see if they’re “part of the problem”, and agencies in the Netherlands should work closely with ISPs, hosting providers, mobile carriers, and businesses to ensure the Netherlands IP space reputation continues to trend positive.
Every GreyNoise user can use the same data provided in this report to gain hourly insights into malicious activity coming from or to organization and agency networks in the Netherlands. Those same queries can be tailored to provide timely alerts for emergent threats being targeted at, or coming from, Netherlands networks. By working together, we can help reduce the number of active botnet nodes on the internet, and make the internet that much safer for the humans we’re aiming to protect.
A GreyNoise “Tag” is a signature-based detection method used to capture patterns and create subsets in our planetary-scale internet sensor data. Tags cover five primary categories: Activity, Tool, Actor, Worm, and Search Engine. These tags are not limited to CVE-based activity but also include behaviours, attribution, and unique traffic characteristics.
Activity tags cover crawlers, vulnerability checks & exploitation, authentication attempts, and other behaviours observed from interactions with GreyNoise sensors. Tool tags can include open-source scanning tools and programming language libraries, such as NMap, Nuclei, Metasploit, Paramiko, and Go HTTP. Actor tags describe the actor behind the activity, including commercial/enterprise entities, researchers, and universities. Please note that all current Actor tags denote Benign actors. This may change in the future, but GreyNoise does not presently engage in malicious actor attribution.
GreyNoise tags provide insight into IP addresses that are scanning the internet or attempting to opportunistically exploit hosts across the internet. Tag data associated with a specific IP address offers an overview of the activity that GreyNoise has observed from that IP, as well as insight into the intention of the activity originating from it.
The following GreyNoise Queries (GNQL) were used in this analysis:
These can be viewed on the GreyNoise Visualizer, or accessed via the GreyNoise API/CLI.
IANA (the Internet Assigned Numbers Authority) is charged with allocating internet address space to regional registries; and, RIPE is responsible for The Netherlands’ address space allocations. Traffic coming from IP address space allocated to a given country does not mean that country has malicious intent. It generally means systems and devices in that country were either vulnerable to some exploit that coopted them into the service of adversaries. However, there are numerous “bulletproof hosting” companies — think of them as a “malicious Amazon AWS” or “evil Google Cloud Platform” — that regularly emerge in any given IP address space as well.
GreyNoise uses IPInfo.io for IP geolocation, autonomous system (ASN), and hosting classification metadata information. Spur is used for identifying VPN, Tor and other network classifications. Kasada is used for bot identification.
In today’s interconnected world, understanding the landscape of malicious internet cyber activity is crucial for organizations and nation states to protect their digital assets and maintain a strong security posture. To that end, researchers from GreyNoise Labs analysed the volume and type of malicious traffic observed by GreyNoise Intelligence’s planetary scale sensor network — with a hyperfocus on The Netherlands — to help organizations and agencies make more informed decisions about their cybersecurity strategies.
The GreyNoise operated sensor fleet primarily sees opportunistic, mass exploitation. This view provides an up-to-the-minute view of the regular drumbeat of botnet activity, but also sheds light on when new patterns or activity surfaces, especially when there are new, emergent threats.
The term “malicious” is reserved for activity that is associated with an attempt to execute an exploit against a target system.
The data for this report looked at malicious traffic coming from or directed at The Netherlands for a period of 30 days in October 2023.
During that time, GreyNoise observed 125,362 malicious exploitation attempts against The Netherlands’ IP address space and 5,207 attacks from The Netherlands’ being directed at other country-assigned networks.
The sections in this brief will look at the source and destination traffic in more detail and conclude with recommendations for how this information can be used to make organizations, agencies, and citizens safer.
The “Research Notes And References” section provides information on the nuances of source-country attribution.
Generally speaking, organizations and agencies can expect to see their malicious source traffic to come from either (a) countries with higher allocated and in-use IP address space, or (b) countries with internet-facing device profiles that lend themselves to be more prone to exploitation.
To see how that mix plays out, Brazil and Vietnam are in fifth and tenth place, below, during the sample period but tenth and twenty-third when it comes to available IP address space. This is due to an inordinately high number of compromised internet of things (IoT) devices, such as IP-accessible cameras, and both white-box and popular-but-regularly-vulnerable networking equipment, such as MicroTik.
This inbound country view will be dynamic if you use the GreyNoise Visualizer or API to perform future assessments. Meaning, members of the list will trade places depending on what adversary controlled infrastructure is in use within any given time period.
You can use geographic source information as one means of risk-assessing connections you see in logs or network flows to help inform blocking or incident response decisions.
The source networks these IP addresses are hosted in can be classified in many ways. For this report, we will focus our attention on the assigned category — ISP, Hosting, Mobile, Business, or Education — for these malicious connection attempts:
Of initial note is that “Mobile” is fourth on the list. Researchers in GreyNoise Labs have observed a steady up tick in mobile networks — whether it be from tethered systems or compromised Android devices — becoming the source of attack traffic. This increases the burden on defenders, since it is difficult to convince application owners to block any connections from what is around 40-50% of all incoming benign traffic to most websites and web applications. The timely nature of GreyNoise block lists may make such conversations less problematic.
Routers, exposed storage and IoT devices, and compromised laptops/desktops are a large part of why residential and small business ISPs regularly top the list. To understand why, all we need to do is look at the top “tags” (“detections” in intrusion detection and prevention nomenclature) GreyNoise sees in this The Netherlands’ inbound traffic:
The Mirai botnet is almost always in the number one spot when it comes to malicious, opportunistic activity engaged by our adversaries, but it often trades places with “SSH Bruteforcer”, which is in the number two spot for this date range in Netherlands’ IP space. Both of these traffic sources are the “heartbeat” of the internet. Not a single minute passes without members of the Mirai botnet searching for new and existing hosts to assimilate into its collective. Similarly, attackers regularly hurl thousands of credentials at every remote login point they can reach. This activity, combined with other “Worm”s, help ensure a healthy inventory that can be used in targeted attacks against your agency or organization.
The “Bruteforcer”s can also be used to build up botnet inventories, but they have a secondary nefarious purpose of working to gain Initial Access, which can be sold to bidders on attacker forums. All it takes is for an organization or individual to leave a default or misconfigured system on the internet for less than an hour to have it become part of this adversarial inventory. It is rare for targeted attack infrastructure to be used for this, quite noisy, activity. Therefore, it is strongly advised to consider blocking these attempts at the network level and checking for outbound requests to IP addresses exhibiting this behaviour.
Before we look at what systems and devices in The Netherlands are targeting, we should note that of the 125,362 inbound malicious exploitation attempts, 800 (0.64%) were directed only at The Netherlands’ during the observation period. This may indicate that organizations, such as the Netherlands National Cyber Security Centre (NCSC), Digital Trust Centre (DTC), Cyber Security Incident Response Team for Digital Service Providers (CSIRT-DSP), and the Dutch Police High Crimes Unit are helping to make country networks sufficiently resilient against attacks to force attackers to direct country-centric efforts elsewhere.
During the study period, GreyNoise researchers observed a mere 5,207 malicious exploitation attempts coming from The Netherlands’-attributed network sources.
The outbound tag distribution is nearly identical to the inbound, so we’ll avoid repetition and focus on two points of interest.
First, “Mobile” networks are fourth on the list:
This is somewhat disconcerting given the discussion in the “Inbound” section. Both the NCSC and other organizations that help provide cybersecurity services to mobile providers and small-to-medium-sized Business (they were ahead of “Mobile” on the list) in The Netherlands may want to consider implementing more rigorous malicious activity checks to reduce the likelihood of these networks being increasingly used in adversarial campaigns.
The next, and final, point is that nodes under adversarial control in the Netherlands seem to be aiming at ally networks, though the malicious traffic is also spread around:
This is unsurprising, as the Netherlands IP address space tends to have a higher positive reputation than many other countries, so initial risk-based “trust” decisions that are part of many perimeter defence systems are more likely to let connections from the Netherlands IP sources through.
Organizations can use GreyNoise to see if they’re “part of the problem”, and agencies in the Netherlands should work closely with ISPs, hosting providers, mobile carriers, and businesses to ensure the Netherlands IP space reputation continues to trend positive.
Every GreyNoise user can use the same data provided in this report to gain hourly insights into malicious activity coming from or to organization and agency networks in the Netherlands. Those same queries can be tailored to provide timely alerts for emergent threats being targeted at, or coming from, Netherlands networks. By working together, we can help reduce the number of active botnet nodes on the internet, and make the internet that much safer for the humans we’re aiming to protect.
A GreyNoise “Tag” is a signature-based detection method used to capture patterns and create subsets in our planetary-scale internet sensor data. Tags cover five primary categories: Activity, Tool, Actor, Worm, and Search Engine. These tags are not limited to CVE-based activity but also include behaviours, attribution, and unique traffic characteristics.
Activity tags cover crawlers, vulnerability checks & exploitation, authentication attempts, and other behaviours observed from interactions with GreyNoise sensors. Tool tags can include open-source scanning tools and programming language libraries, such as NMap, Nuclei, Metasploit, Paramiko, and Go HTTP. Actor tags describe the actor behind the activity, including commercial/enterprise entities, researchers, and universities. Please note that all current Actor tags denote Benign actors. This may change in the future, but GreyNoise does not presently engage in malicious actor attribution.
GreyNoise tags provide insight into IP addresses that are scanning the internet or attempting to opportunistically exploit hosts across the internet. Tag data associated with a specific IP address offers an overview of the activity that GreyNoise has observed from that IP, as well as insight into the intention of the activity originating from it.
The following GreyNoise Queries (GNQL) were used in this analysis:
These can be viewed on the GreyNoise Visualizer, or accessed via the GreyNoise API/CLI.
IANA (the Internet Assigned Numbers Authority) is charged with allocating internet address space to regional registries; and, RIPE is responsible for The Netherlands’ address space allocations. Traffic coming from IP address space allocated to a given country does not mean that country has malicious intent. It generally means systems and devices in that country were either vulnerable to some exploit that coopted them into the service of adversaries. However, there are numerous “bulletproof hosting” companies — think of them as a “malicious Amazon AWS” or “evil Google Cloud Platform” — that regularly emerge in any given IP address space as well.
GreyNoise uses IPInfo.io for IP geolocation, autonomous system (ASN), and hosting classification metadata information. Spur is used for identifying VPN, Tor and other network classifications. Kasada is used for bot identification.
 Explore Our Data
