


Every day, GreyNoise's global sensor network observes scans and attacker traffic from hundreds of thousands of IPs across the internet. GreyNoise analyzes that activity to understand what each IP is doing, why it matters, and which tags and CVEs are connected to it. You can explore it all in the Visualizer.
The Intelligence Dashboard, available now, gives that intelligence a home. You can pin any combination of CVEs, tags, countries, IPs, and GNQL queries into one persistent, always-current view. Open it, and the activity you care about is already there, up to date.
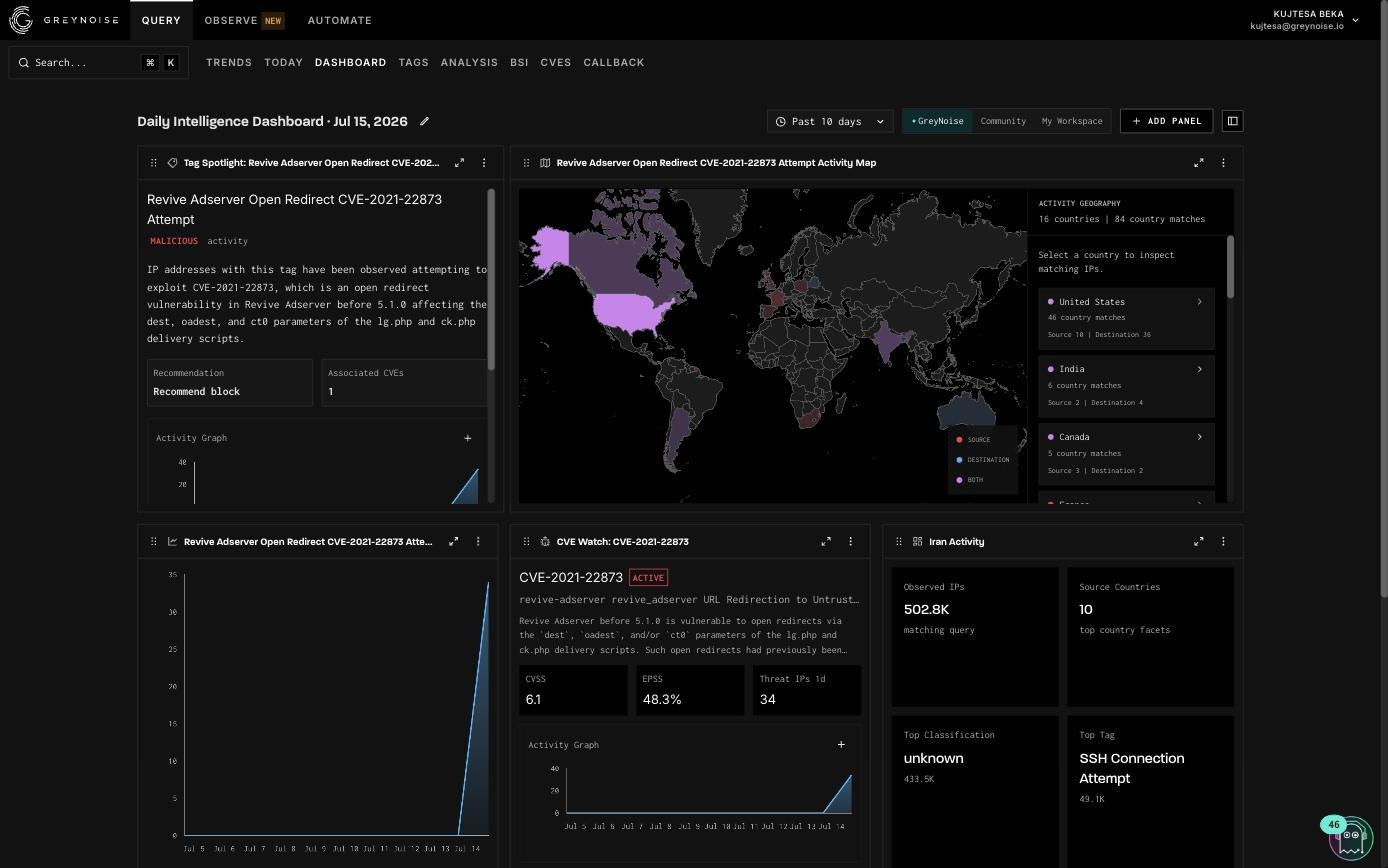
See the Intelligence Dashboard in action
The first time you open the Dashboard tab, GreyNoise builds a Daily Intelligence Dashboard for you, stamped with today’s date and populated from what is currently notable across the sensor network. It is a starting point, not something you have to maintain. Edit it, save your own version, or let it regenerate fresh the next day.
Watch how to build a dashboard from scratch, add and configure panels, and save it for ongoing use.
What you can put on a dashboard
A dashboard is a set of panels. Each panel combines a panel type (how the data is shown) with a focus (what it shows activity for).
There are five panel types:
And five ways to focus a panel:
The GNQL focus is the most flexible option. Any query you already run in GreyNoise can become a live dashboard panel, so a standing query like tags:mirai classification:malicious turns into something you watch instead of rerunning every time. Just give the panel a name (a sensible default is suggested), and click *Add Panel*.
Make it your own
Every dashboard is built from panels, and adding one takes just a few clicks: pick a panel type and a focus, give it a name, and it lands on your dashboard already populated. You can drag panels to rearrange them, resize them, or expand any panel to full screen.
For the full step-by-step, including every panel type, focus option, and layout control, see the Intelligence Dashboard documentation.

Navigating a dashboard
Two controls in the header apply to every panel at once:
- Time range: switch the whole board between the past 24 hours and the past 10 days.
- Data source: choose which sensor data the panels query. GreyNoise’s global network by default, Community sensors, your own workspace sensors, or a combination.
The Activity Map is worth a closer look. Countries are color-coded to show whether they are the source of activity, the destination, or both. Click any country on the map or in the sidebar to see the IPs the activity is coming from and the IPs being targeted, along with the organization that owns each one. Every IP links to its detail page, while “View all IPs” in the Visualizer opens the full result set as a GNQL query. When building a map panel, you can also filter it by source or destination country. For example, you could create a map that only shows activity targeting the regions where you operate.
Changes are not saved automatically. When you have unsaved edits, a banner appears with a “Save” button. The dashboard manager, accessed through the panel icon in the header, lets you switch between saved dashboards, search by name, create a new dashboard, or delete one. Dashboards are personal to you within your workspace. You can save up to 50 dashboards, with up to 24 panels in each.
Quick tip: which data source should I use?
- Use GreyNoise to see what is happening across the internet at large.
- Use My Workspace to focus a dashboard on what your own deployed sensors are seeing.
Community and My Workspace require a deployed Swarm sensor. Once you deploy one, access is granted within about 6 hours.
Access and availability
The Intelligence Dashboard is available to all signed-in GreyNoise users. GreyNoise customers and Community users with a business email get at least 10 days of data lookback, while Community users with a consumer email get 2 days. Available data sources may also vary by account type.
To build your first dashboard, open the GreyNoise Visualizer and navigate to Query → Dashboard.
Ready to get started?
- Current customers: Log in to the Visualizer, start from the daily view, and save your first dashboard.
- Not a customer yet? Contact Sales to learn more.




.png)
