
GreyNoise integration with Google Security Operations enables improved dashboards, detection rules, playbooks, and webhook support
Your SIEM ingests everything. Every port scan, every crawl, every opportunistic spray across the internet. The problem isn't the collection — it's context. Which of those IPs are scanning everyone, and which ones are targeting you?
That's the question GreyNoise answers. We observe over over 800,000 unique IPs daily across 5,000+ sensors in 80+ countries, classifying each as malicious, suspicious, benign, or unknown, and tagging them with 3,000+ behavioral descriptors. Traditional threat feeds add more indicators to investigate. GreyNoise removes the ones that don't matter.
Today, we're announcing a new and improved integration with Google Security Operations — delivering standardized indicator ingestion, pre-built dashboards, YARA-L detection rules, saved searches, response actions, webhook support, and ready-to-deploy playbooks.
What's New: Event Management
New Ingestion Script
The GreyNoise ingestion script is now available in Google Security Operations ingestion-scripts repository — a standardized process for importing threat intelligence indicators into your environment. Deployed as a Google Cloud function, it pulls IP reputation data and GNQL query results from the GreyNoise API and ingests them via the Google Security Operations API. The default configuration focuses on malicious IPs observed in the last 24 hours, but teams can customize the GNQL query to match their threat profile.
New Dashboards
Two interactive dashboards ship with the integration into Google Security Operations:
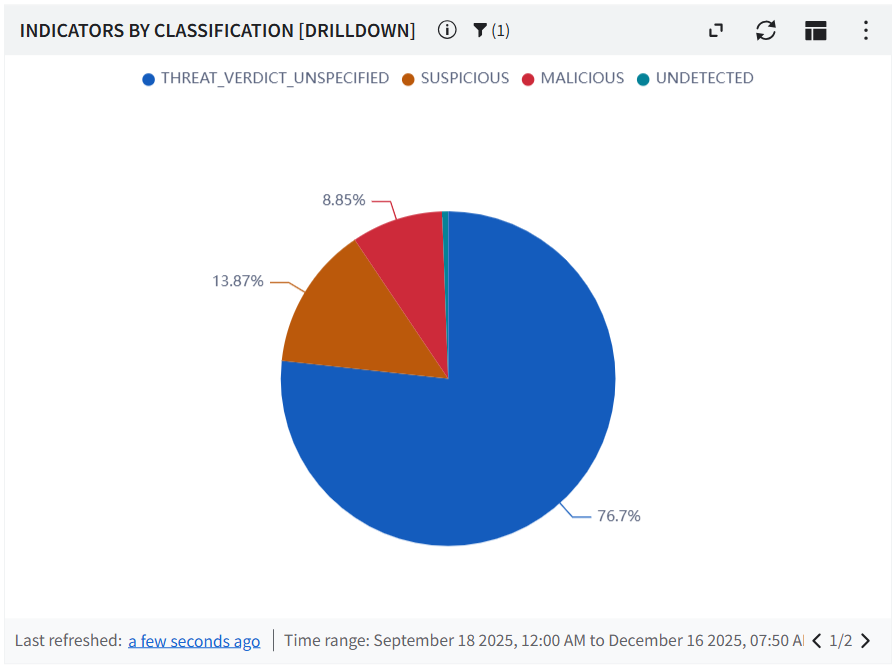
Indicator Dashboard — 15+ visualization panels covering classification distribution (Malicious, Suspicious, Benign, Unknown), top 10 rankings for organizations, actors, tags, ASNs, categories, operating systems, and source countries, plus CVE distribution, trend analysis, and business service intelligence.
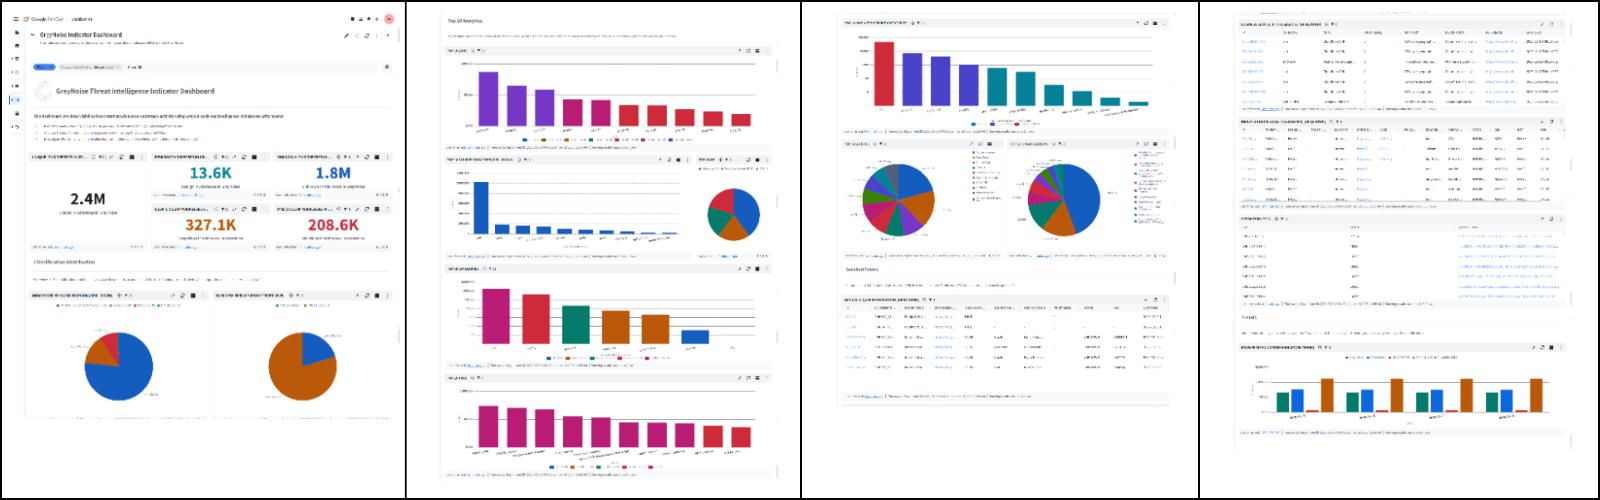
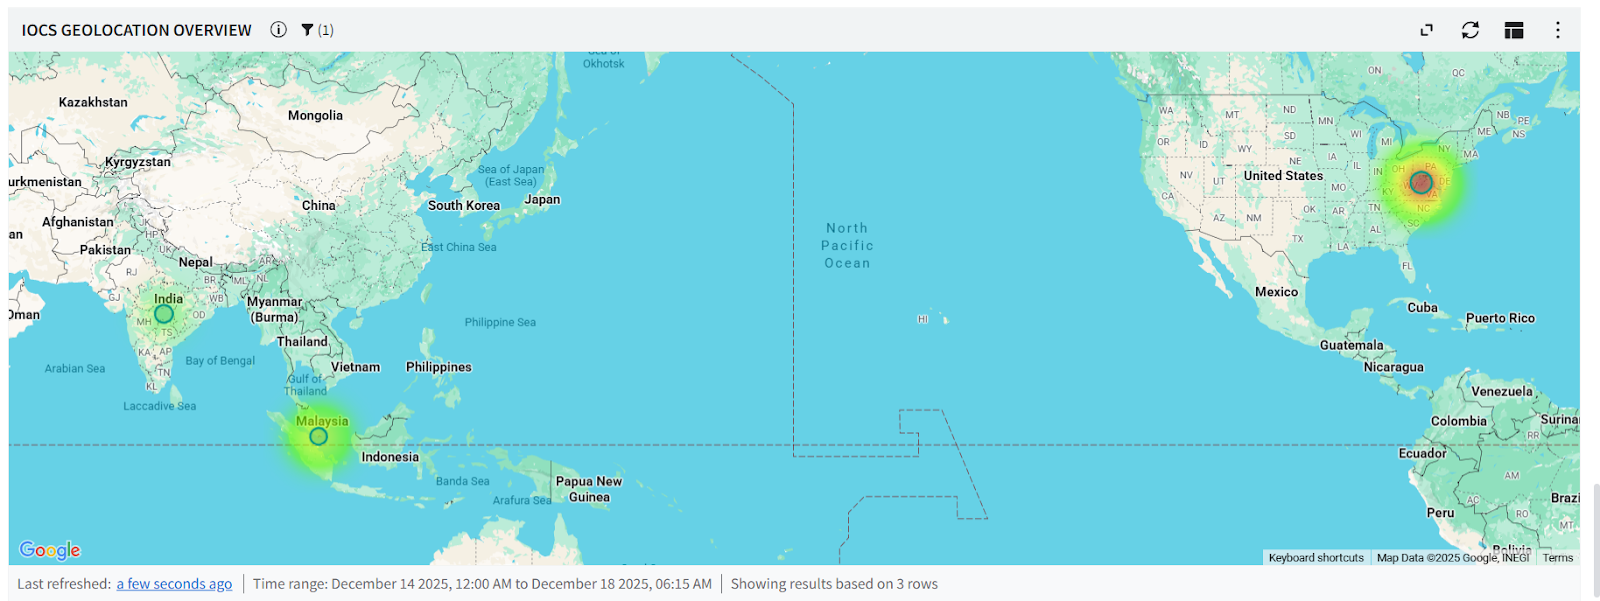
Correlation Dashboard — Shows IOC matches between GreyNoise intelligence and events from your environment, with geolocation mapping, event match trends, classification breakdowns, and top IP indicator rankings.
.png)
New YARA-L Detection Rules
Three ready-to-deploy rules that start correlating immediately:
- IP Match — Detects events where a source or principal IP matches a malicious or suspicious GreyNoise indicator, correlating over a 1-hour window.
- Inbound Network Traffic with ASN Context — High-severity rule monitoring firewall logs for permitted inbound connections from GreyNoise-flagged malicious IPs, enriched with ASN attribution.
- Brute Force Attack Detection — High-severity rule flagging 5+ blocked login attempts from GreyNoise-flagged IPs within a 15-minute window.
New Saved Searches
Four pre-built UDM queries for investigation workflows:
- IP Risk & Vulnerability Details — Classification, anonymization signals, CVEs, and activity timelines
- Indicator Context Summary — Actor attribution, geographic details, organizations, and tags
- High Risk Indicators — Filters for MALICIOUS or SUSPICIOUS classifications only
- All Indicator Lookup — Browse all ingested GreyNoise indicators for ad-hoc investigation
What's New: Response Workflows
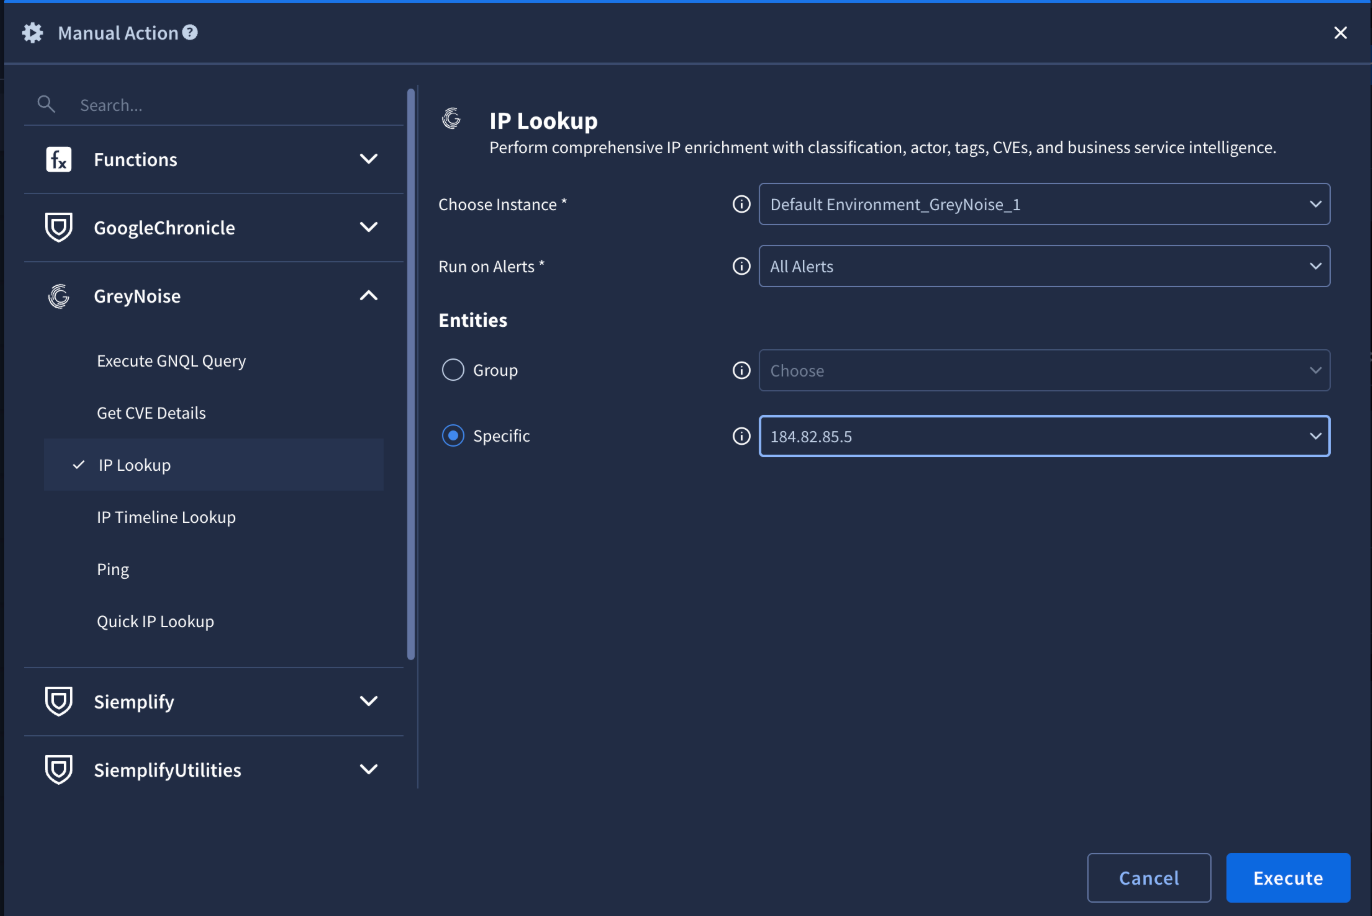
Updated Response Actions (v7.0)
The GreyNoise response integration has been updated to version 7.0 with the full suite of actions:
New Webhook Support
A major addition: webhook support for ingesting GreyNoise alerts and event feeds directly into Google Security Operations. Three webhook types are now available:
- Alert Webhook — Ingests IP, CVE, TAG, and GNQL Query alerts
- IP Change Webhook — Tracks classification changes in real time
- CVE/Tag Webhook — Monitors CVE spikes, status changes, vendor activity, and tag spikes
New Playbooks
Pre-built playbooks ship with the integration, providing ready-made automation workflows that teams can deploy or customize. Combined with the webhook connectors and the Generate Alert from GreyNoise GNQL connector, security teams can build end-to-end automated triage pipelines.
How It Works Together
- 1. Ingest — The event management integration continuously pulls GreyNoise indicators into Google Security Operations with fresh scanner data.
- 2. Detect — YARA-L detection rules flag events that correlate with known scanners. Dashboards provide visual context.
- 3. Investigate — Saved searches surface IP risk details, actor attribution, and CVE context without writing queries.
- 4. Respond — Response playbooks enrich flagged IPs automatically. Mass scanners get deprioritized. Targeted activity escalates for review.
Webhooks close the loop by pushing GreyNoise alerts — including classification changes and CVE spikes — directly into Google Securioty Operations for quick action.
Who Has Access
This integration is available to any joint Google Security Operations customer with a GreyNoise API key. No additional licensing required — just configure and go.
Learn More and Get Started
Ready to bring GreyNoise intelligence into your Google Security Operations environment? Learn more here:
- SIEM Integration Guide
- SOAR Integration Guide
- SIEM Resources (Dashboards, Rules, Searches)
- Google Google Security Operations Ingestion Script


.png)


.png)


.png)


